We’re back, baby!
In which we return to the ship and begin the journey north
Greetings to our many fans and followers! There are dozens of you!
We are headed back to our study site after a year to recover the broadband seismometers that were deployed in Sept 2021. This array of 28 instruments was designed to characterize background seismicity on the central part of the Queen Charlotte Fault near the 2013 M7.5 Craig, Alaska earthquake. And we get to take the R/V Langseth again! It’s great to be back on the ship with many of the same crew.
View of downtown Seattle from Pier 90, Elliot Bay.
We boarded the ship in Seattle on September 9 and left the dock at noon on the 10th. We have about 3 days of transit to the first ocean bottom seismometer (OBS) recovery site. We are on our second shifts and the science party is doing great so far.
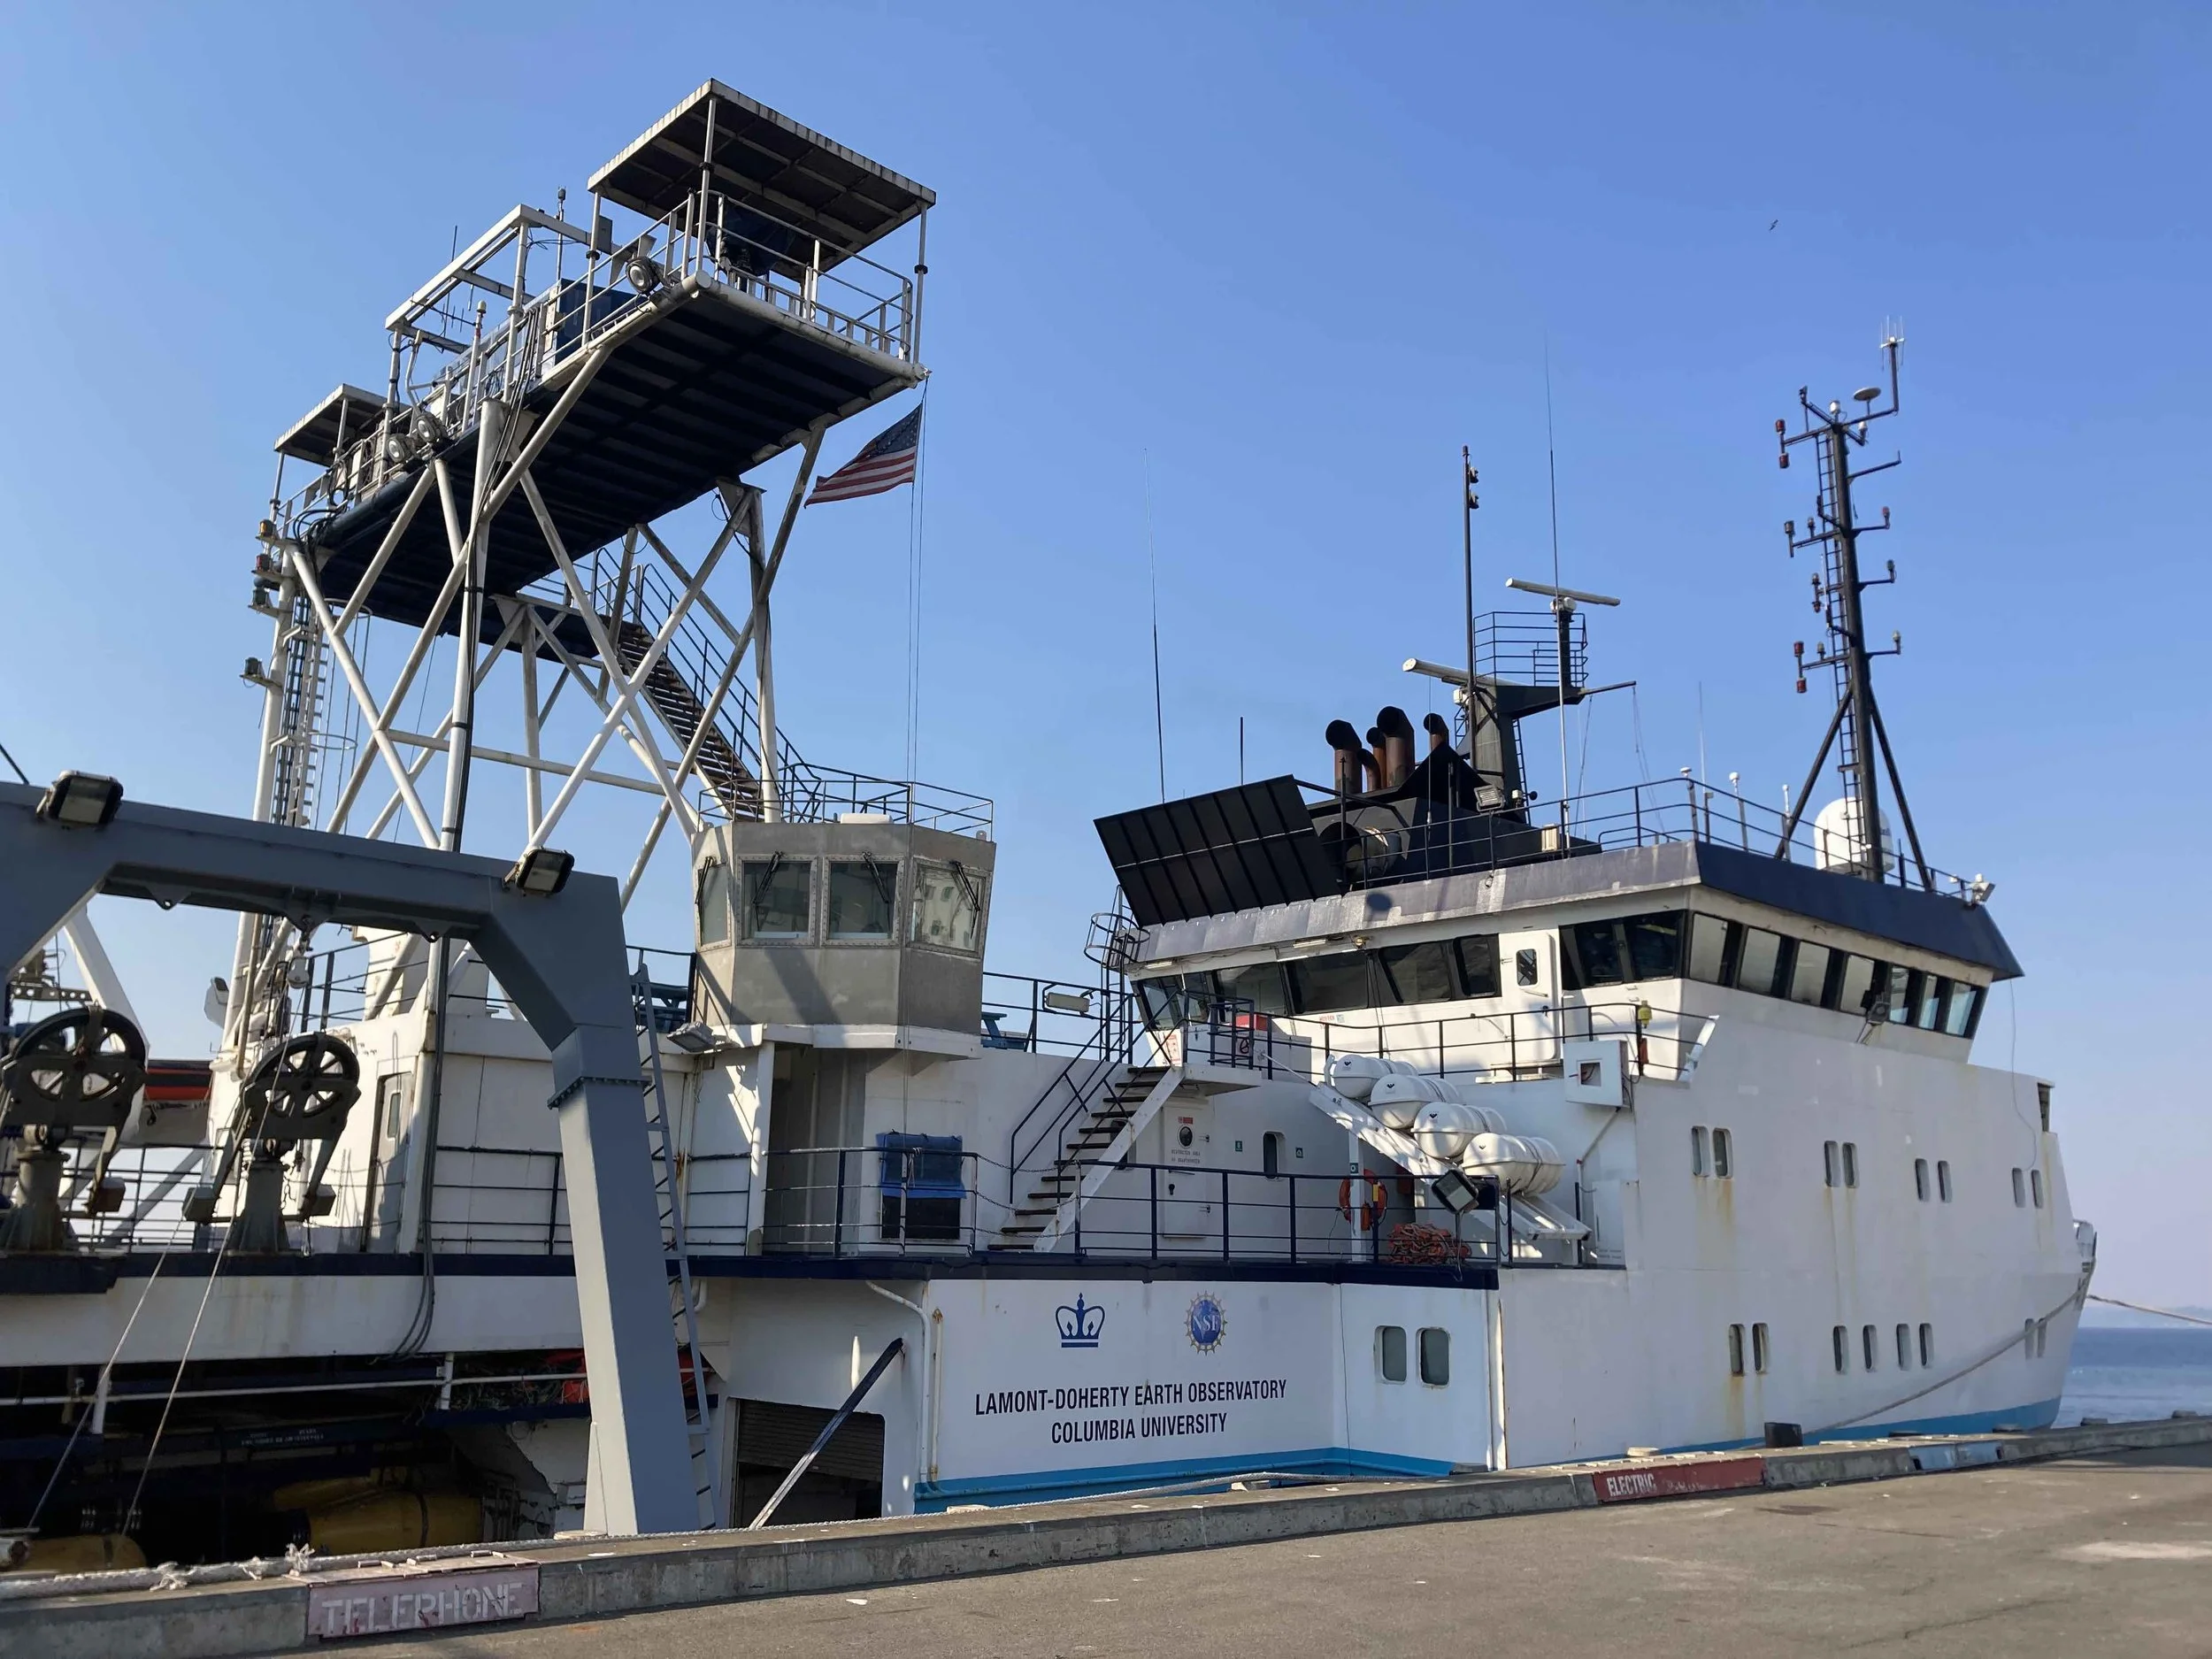
The R/V Langseth, docked at Pier 90. Ready to roll!
This year’s experience has been so different from last year…in 2021 we had COVID quarantines, a very small team and masks always required indoors. This year, no quarantine—everyone had multiple negative tests before boarding—no masks, and a big, fun science party! Along with the co-chief scientists, we have a couple of postdocs, a graduate student and six undergraduate students joining us from Western Washington University. We also have a team of 4 OBS instrument technicians and engineers.
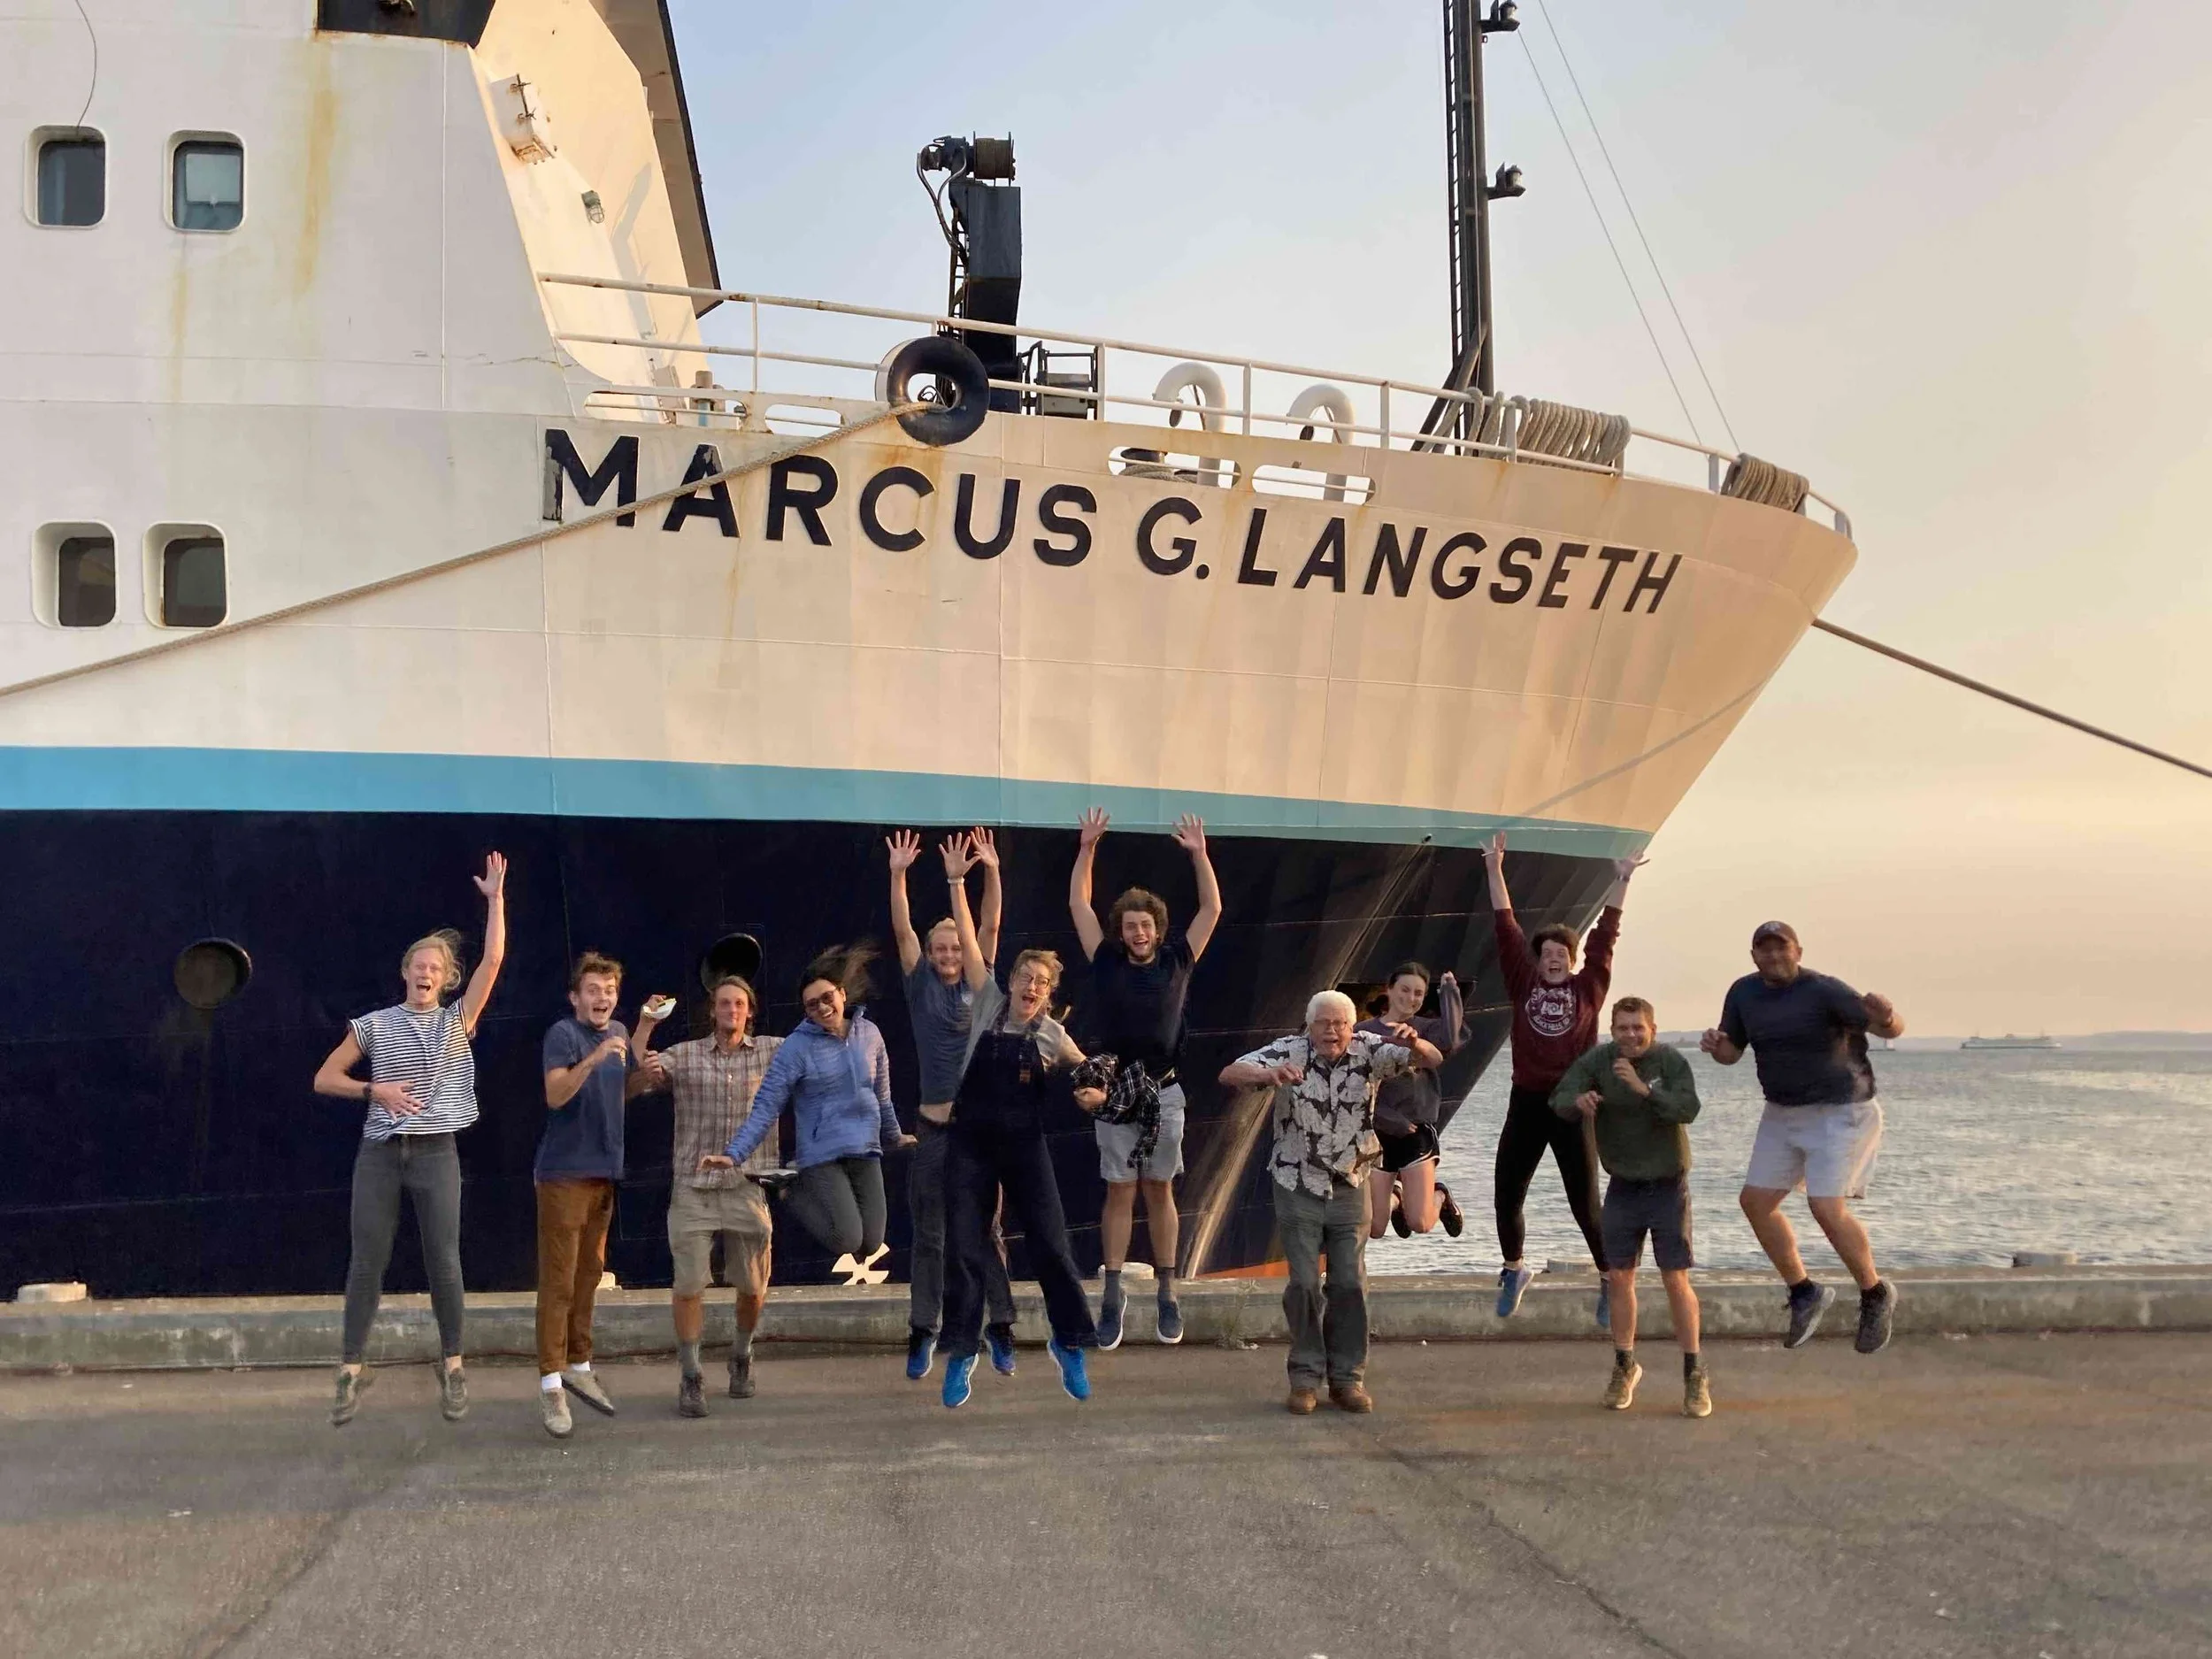
Ain’t no party like a science party! Students, PIs and scientists ready to go.
Having the students aboard is great and we are doing lots of training and learning about the ship’s systems and deck work and safety. We are standing watch, processing bathymetry data and eagerly awaiting our first OBS recovery coming up sometime tomorrow!
Stay tuned for more info and some slices of day to day living on the Langseth!
Blog post by Lindsay Worthington
All the Whales
This is a guest post by University of New Mexico graduate student, Sarah Nolt-Caraway…go for it, Sarah!
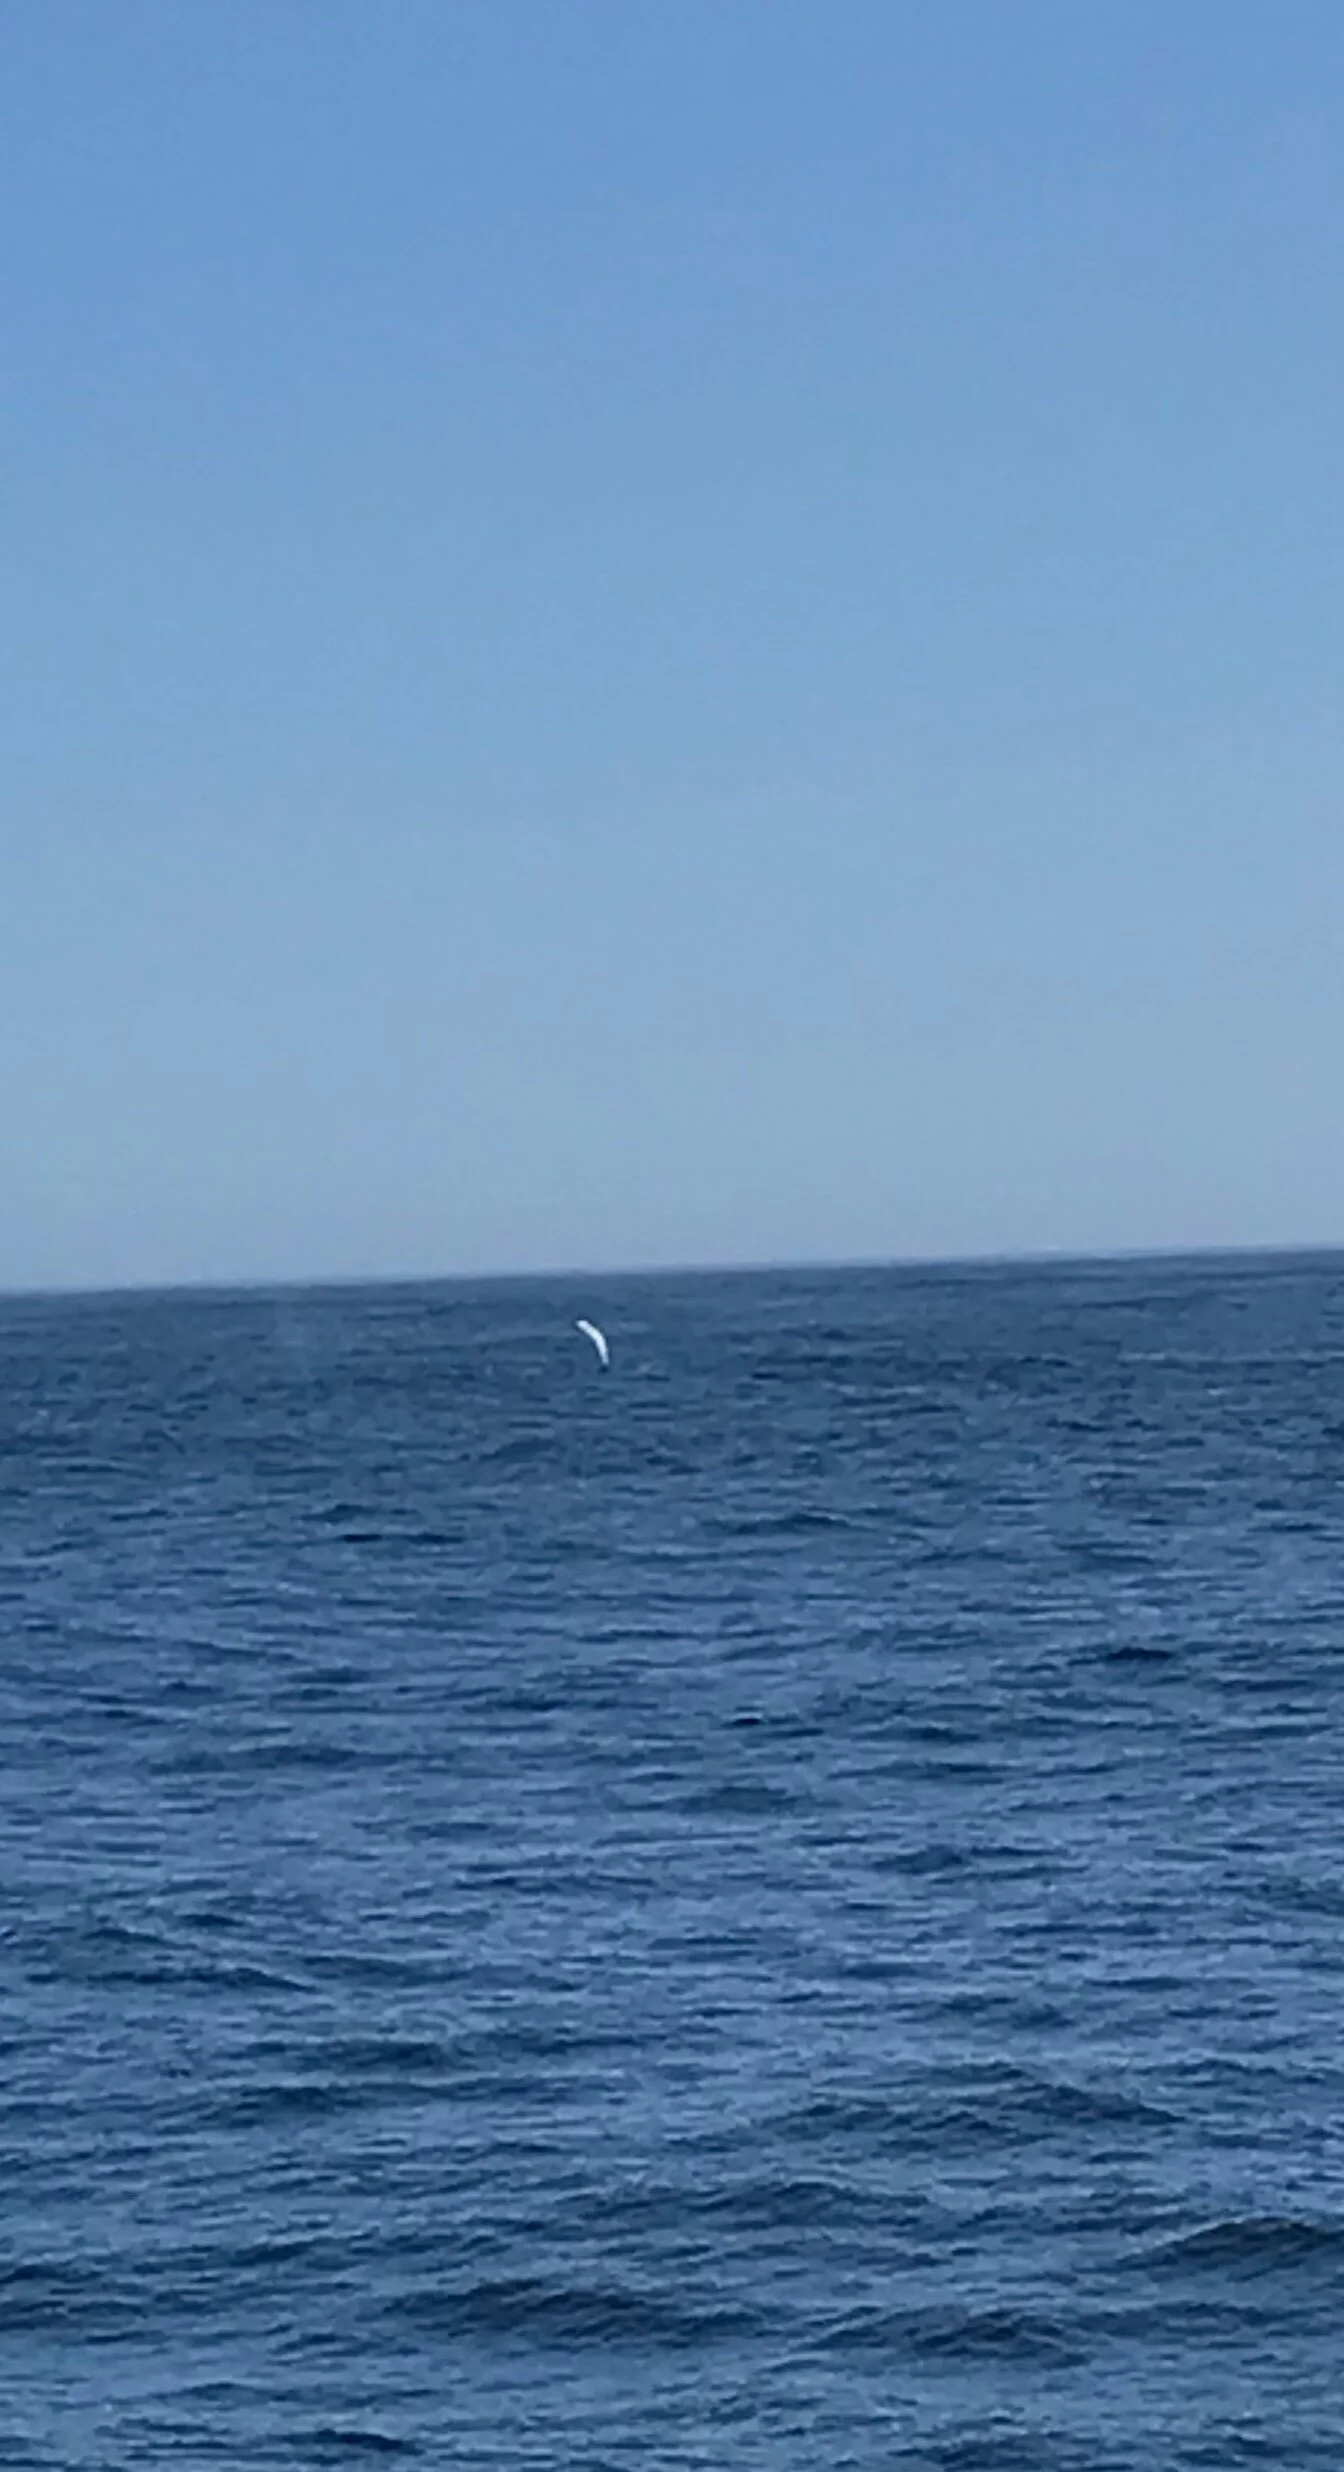
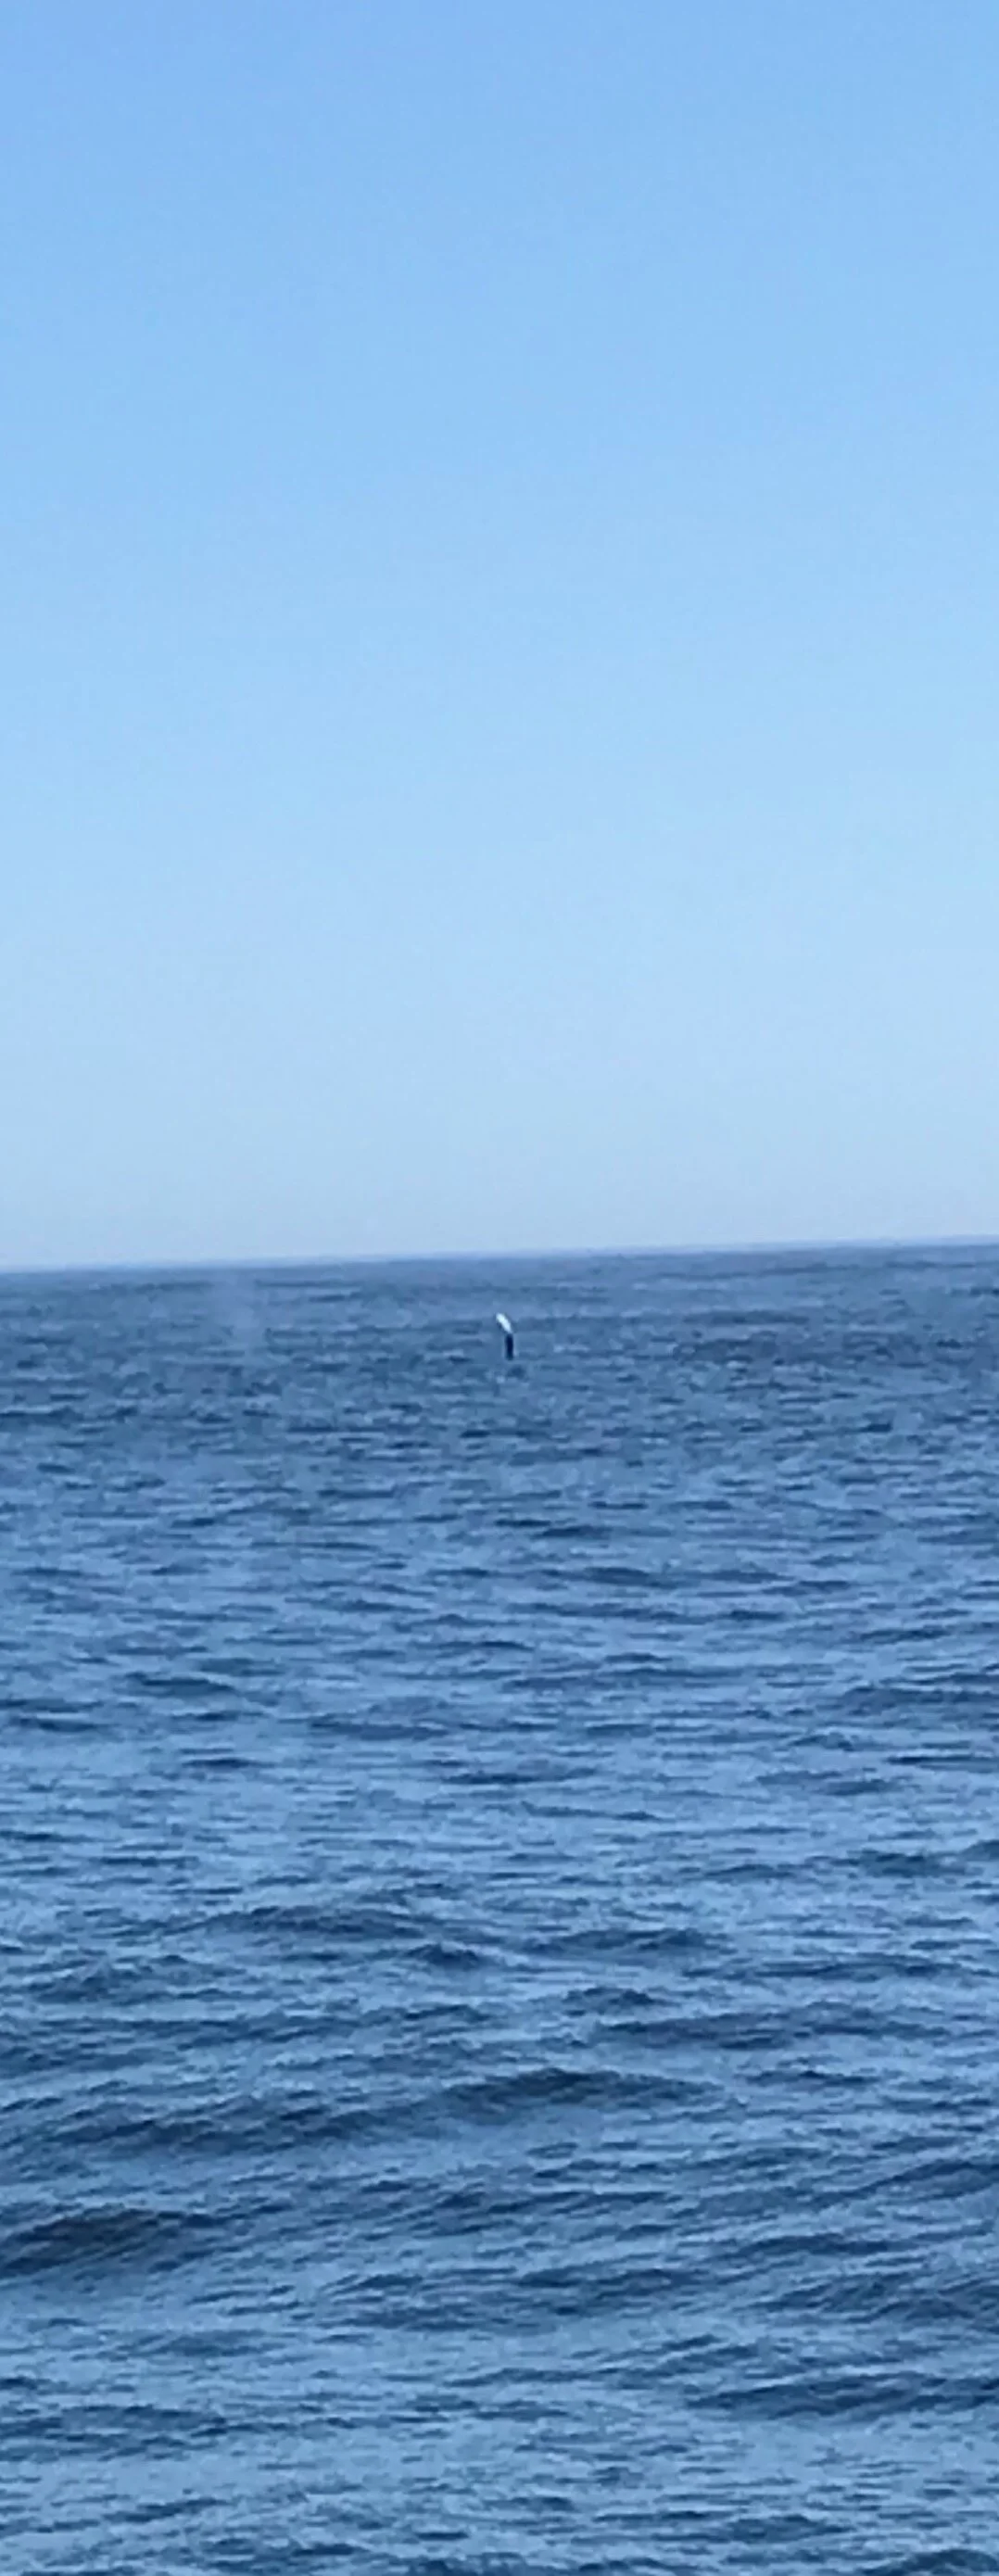
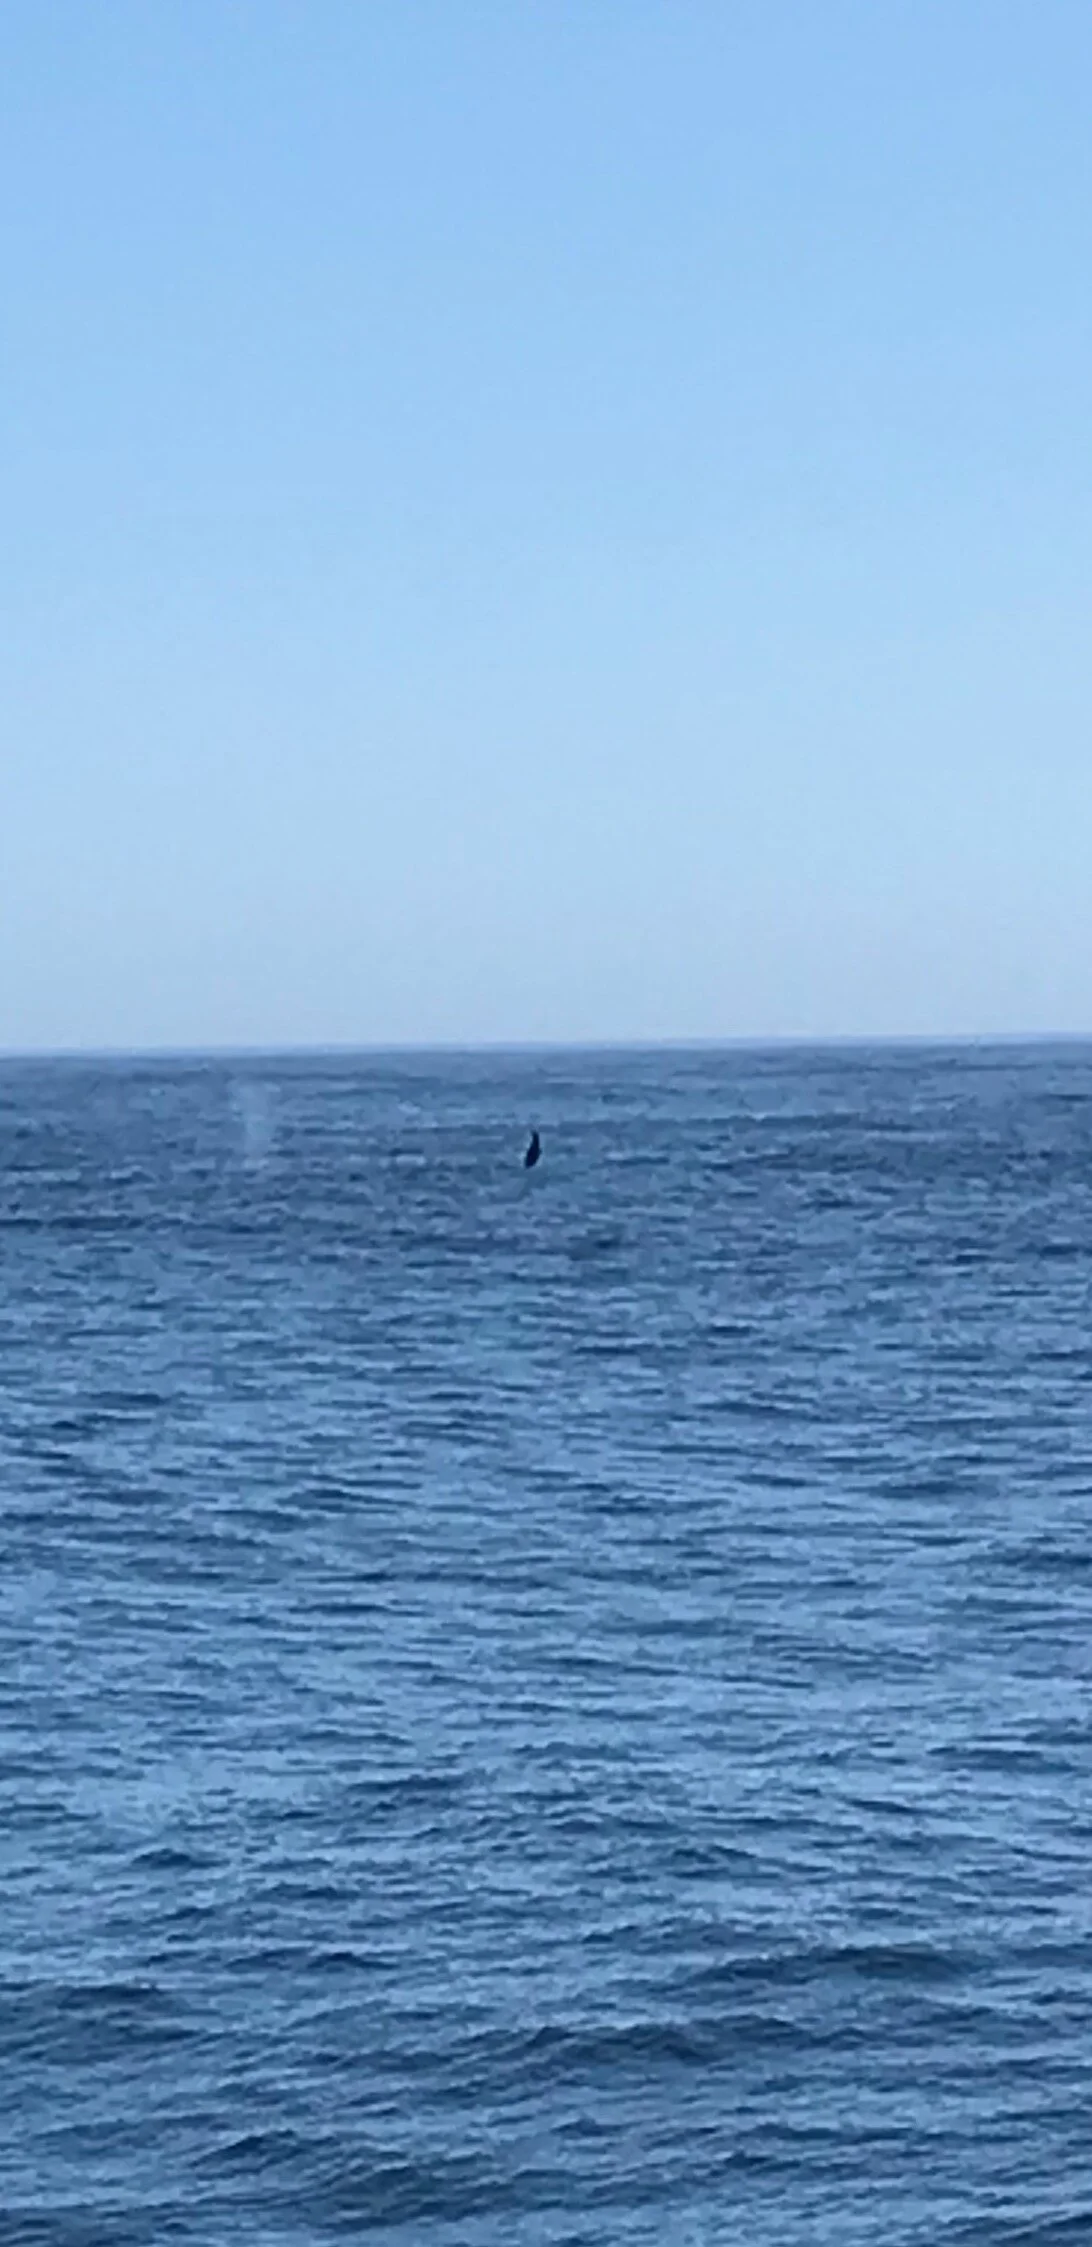
During this cruise, we have an amazing opportunity to sea the vast marine life in the North Pacific Ocean. We have seen everything from humpback whales, fin whales, dolphins, great white sharks, sunfish, all types of birds, and porpoises- just to name a few. An important aspect of this cruise is observing these sea critters and monitoring the protected species, such as marine mammals, sea turtles, and several species of birds. This is to minimize the potential effects of the seismic survey.
Great white shark beneath the glassy sea surface.
There are an additional five scientists on this vessel that take part in monitoring the marine life. These are the Protected Species Observers (PSO’s). They are licensed, approved by government agencies, and independently contracted. During visible hours and good weather, the PSO’s work in the observation tower, equipped with bigeye binoculars, which can see for several kilometers out, as well as DSLR cameras. At all hours of the day and night, there is always a PSO using the passive acoustic monitoring (PAM) system. PAM is a four-hydrophone array, off the port stern, designed to detect and localize different whale and dolphin species vocalizations.
Sea spray from a blue whale
So, what if the PSO’s observe marine life? First, they must determine what species it is. If it is a protected species, they then determine distance the species is from the vessel. If the species is within the countries’ designated radius, they call the lab to inform us to disable our sound source. These silent periods last typically 30 minutes to an hour after visualization.
The PSO’s workday and night during the entire cruise. They collect crucial information about these species and the environment. At the end of the cruise, the PSO’s put together a comprehensive final report about their observations, including photos taken, sightings, key identifiers of the species, and behavior; and submit it to the agencies that approved the seismic survey. The information collected and submitted in this report is further used for the broader understanding of these species, such as migratory, feeding, and mating behaviors.
Humpback whale beginning a dive
It has been an incredible experience to work along the PSO’s, as they have provided the researchers and crew members and opportunity to see extraordinary sightings of marine life. They also have spectacular photos of the marine life, which are included in this post.
Back to the south…
Greetings from the Langseth, chief scientist Lindsay here! We are fully in the home stretch now!! After more than 4000 km of data acquisition and 33 days at sea we are entering the final stages of the project and have less than 20 hrs of data collection to go!
The moon sets over Haida Gwaii and the back deck of the Langseth on our second to last night of shooting.
The northern Pacific offshore British Columbia and southeast Alaska is a whale hotspot and we do our best to keep our impact on the animals to a minimum. Onboard, we have a crew of protected species observers (PSOs) whose job is to keep watch for whales, dolphins and other protected animals. If they see an animal come within the mitigation area, we shut down our airguns and wait for them to clear the area. After the animals clear the area, we wait another hour before ramping up the sound source again.
Friendly dolphins riding the bow waves.
In the southern part of the study area, near Haida Gwaii, we saw whale after whale after whale. So, that means we had some parts of our planned survey that we didn’t get to in the early part of the survey. After finishing the rest of the data collection in the northern and central parts of the survey area, we are heading back south to try to fill in the data gaps. After that, we will start picking up the airguns and the 15 km streamer and make our way back to shore.
Science party ready to end strong.
Our Favorite Streaming Service
In the middle of the North Pacific, we’re not able to Netflix and chill—but we’ve got other streaming happening all the time! One of the Langseth technicians joins us for a guest post highlighting the king of castle out here—our seismic streamer….take it away, Klay!!
The Seismic Streamer
The streamer in the water—the end of it is 15 km away from the ship, way past the horizon.
The research vessel Marcus G. Langseth, which is being used to collect the data on this cruise, is a specialized vessel that is rigged to carry and deploy seismic streamer and airguns. The streamer is a plastic tube filled with hydrophones, electronics, wires and foam that is connected together from 150m long sections and deployed out the back of the ship as it moves through the water at 4 to 5 knots (about 5 miles per hour). On this cruise the streamer is 15 km long, therefore needing 100 sections, and containing 9,600 hydrophones (8 per channel, 12 channels per section). The streamer is stored on several reels that are 10 feet wide and 15 feet high, and which are powered by hydraulics to turn them. When deploying the streamers, the reels are turned to let the streamer out and it then trails behind the ship. There is a tail buoy that is connected to the tail end of the streamer which floats on the surface and has a radar reflector, GPS, and AIS so that ships can see where the end of the streamer is located in order to not run over the streamer.
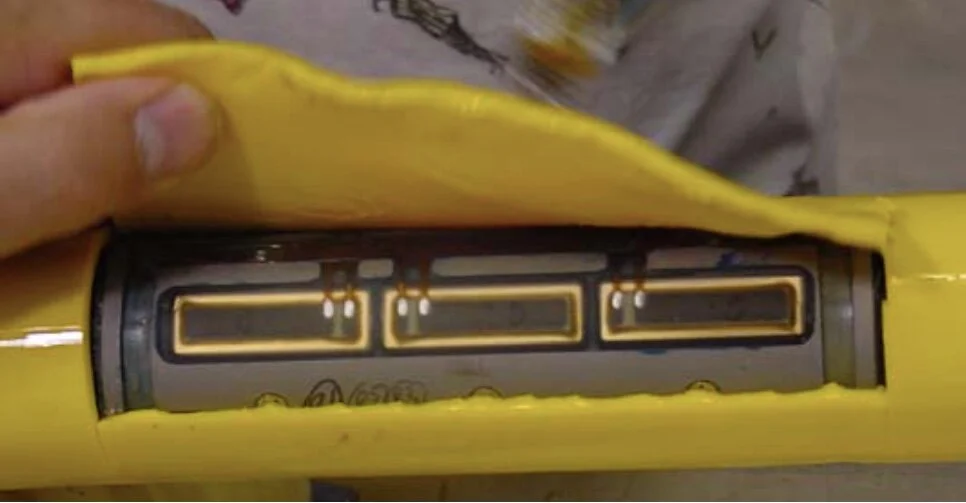
The yellow ‘skin’ of the streamer protects hydrophones (shown here) and other electronics.
It is very important for the streamer to stay at a specific depth as it streams behind the ship collecting data, and in order for this to happen the streamer needs to be ballasted with weights, and controlled by ‘birds’. The ballasting is controlled by adding or removing 1 kg lead weights on the outside of the streamer based on the density of the water in the area of the survey. Different temperature and salinity of seawater in different areas of the world will cause the streamer to float or sink, and weights are used to make it neutrally buoyant. In this area we are using three weights per streamer. Once it has become neutrally buoyant it is easier to control the depth with ‘birds’. The birds are battery operated devices that can be set to maintain a depth by moving wings at an up angle or down angle, which when moving through the water will cause the bird and streamer to increase or decrease depth. The bird depths and wing angle can be controlled and changed after they are deployed on the streamer and throughout the survey from a computer interface on the ship. The birds also have a compass in them, which, when used all together can show what direction the streamer is at the bird position, and therefore give an overall shape and position of the streamer behind the ship. The birds are placed every 300 meters along the streamer and can rotate freely around the axis of the streamer. Attached to each bird is a Streamer Recovery Device (SRD), which contains an airbag that will automatically inflate if we loose control of the streamer and it goes below 45 meters. This will bring it to the surface to keep it from being damaged at depth, or lost completely.
Western Washington University graduate student, Lazaro Garza, after attaching a bird during streamer deployment.
When the airguns fire and create a seismic signal, the seismic wave goes down to the seafloor, and layers of geology under the seafloor, and are reflected and refracted back up through water and hit the hydrophones in the streamer. The hydrophones are made of ceramic piezoelectric material which converts the seismic pressure wave to electricity. This electrical signal is then digitized from an analogue signal collected by a group of hydrophones within each section. The digitized data from the hydrophones of every five sections is then collected by modules (basically modems) on the streamer before being then sent as a digital packets to the ship. When this data is received on the ship by equipment and software it then allows an observer to see the seismic signal in real time and ensure that it is of good quality as it is recorded. Once this data is recorded it can be then processed by computer programs to give the scientists a view of the geology under the seafloor.
Klay Curtis - Technician
The Right Place, at the Right Time, with the Right Equipment
On July 29, 2021 at 06:15 UTC (July 28, 2021 at 23:15 PDT, local time) a magnitude 8.2 earthquake struck offshore the Alaska Peninsula near Perryville, AK at a depth of ~32 km below the seafloor. This earthquake was the largest event in the US since 1965 and the largest in the world since the Fiji earthquake in 2018. It caused widespread tsunami warnings across the Pacific rim, with evacuations on the Homer Spit in Alaska. Thankfully, no major damage was caused by the resulting small tsunami. All warnings were downgraded and eventually cancelled.
In another region of the Pacific Ocean, ~1600 km away, the R/V Marcus G. Langseth was collecting active source seismic data to assess the tectonics and hazards associated with the Queen Charlotte Fault. To collect this data, the R/V Langseth was towing a 15 km long acoustic receiving device (called a streamer) to record acoustic waves generated by the ship to image the sub-seafloor geology. The scientific team also deployed a series of ocean bottom seismometers (OBS) to record the acoustic energy from the ship and any seismic events, such as the Perryville earthquake (see previous blog post by Maureen Walton).
At approximately 06:34 UTC (23:34 PDT) a massive spike in the noise on the R/V Langseth hydrophone streamer caused onboard scientists (including myself) and technicians to take notice. What just happened? Why was the noise level so high all of a sudden? Is something wrong with the equipment? After some quick discussion and examination of the data, we noted the noise was traveling down the streamer, from the ship to the tail buoy over 15 km behind us. We also noted that the noise was a linear arrival traveling at a constant speed along the steamer (straight diagonal lines in image below). After ~40 seconds the noise was mostly gone, rapidly dissipating, so it didn’t seem like an instrument issue.
We quickly noted this event looked similar to events caused by earthquakes seen on other scientific expeditions in Chile (by myself in 2017) and along the Aleutians near Dutch Harbor, AK (by technician Gilles Guérin in 2020). So, Klay Curtis (technician on board the R/V Langseth), Laz Garza (WWU graduate student), and I searched the USGS earthquake website to find recent earthquakes that could have introduced energy into the water column, and we found information on a massive earthquake across the Pacific. The timing was right for an acoustic arrival traveling at ~1500 m/s (sound speed in sea water), so this could be our noise source!
A normal “shot gather” showing the data we collect from the 15 km streamer.
A “shot gather” overwhelmed by the earthquake energy! Note the earthquake noise appears as linear features in the data window.
After loading the data collected by the streamer, I explored finding the azimuth of the arrival to verify the source of the noise. We recorded the acoustic wave propagation along the entire 15 km streamer, which allows us to calculate the velocity of the traveling wave. The apparent velocity of the noise was ~1820 m/s, much faster than the 1500 m/s speed of sound in sea water. However, this noise was not generated directly in front of our ship, instead the energy was traveling obliquely to our heading, making the velocity appear much higher. Using the apparent velocity, I did a little trigonometry (thank you high school trig) to determine the difference in our heading (326°) and the azimuth of the earthquake arrival (289° based on USGS event localization). I calculated an azimuth difference of ~35° based on the streamer data, very close to the 37° in reality. (For you nerds out there, this is without accounting for the streamer feathering with was ~1.2° to the starboard, which would bring our azimuth difference to within 1°! Pretty good for a scratch pad of paper, a little trigonometry, and an opportune acoustic receiver).
8.2 Perryville, AK earthquake (pin) and our approximate location offshore Haida Gwaii in the southeast. The red line shows the path the T-phase traveled to reach us over 1600 km away.
In the end, our working hypothesis is that our hydrophone streamer recorded a T-phase, or an acoustic wave generated by an earthquake that travels at the speed of sound through water. We think this T-phase was generated by the 8.2 Perryville, AK earthquake. The seismic energy propagated from the ~32 km deep rupture location offshore the Alaska Peninsula to the seafloor and down the continental slope. There, the seismic energy interacted with the SOFAR channel (I’ll let you read more about that without me), which converted the energy into acoustic waves in a process called “downslope conversion.” This interaction “trapped” the acoustic waves in the water column and helped propagate them, without losing too much energy, across the Pacific Ocean. Approximately 19 minutes later, the R/V Langseth recorded this event on the hydrophone streamer to the surprise (and eventual exhilaration) of the onboard crew. Without the T-phase and SOFAR channel interaction, we likely would not have seen this event on the streamer, even given the huge amounts of energy released during the earthquake rupture (but our deployed OBS would definitely record the arrival). It was a fortuitous set of circumstances that we were at the right place, at the right time, with the right equipment to capture this unique occurrence.
All in a night’s work onboard the R/V Marcus G. Langseth! Special thanks to Klay Curtis for nerding out with me as we explored this interesting event.
Benjamin Phrampus, US Naval Research Laboratory research geophysicist and co-chief scientist aboard the R/V Marcus G. Langseth.
(some of) The Science Behind the Seismometers
Quite a bit of time, money, and effort has into this experiment… but why? Do we really need two ships? What is the science driving this experiment? What do we hope to learn?
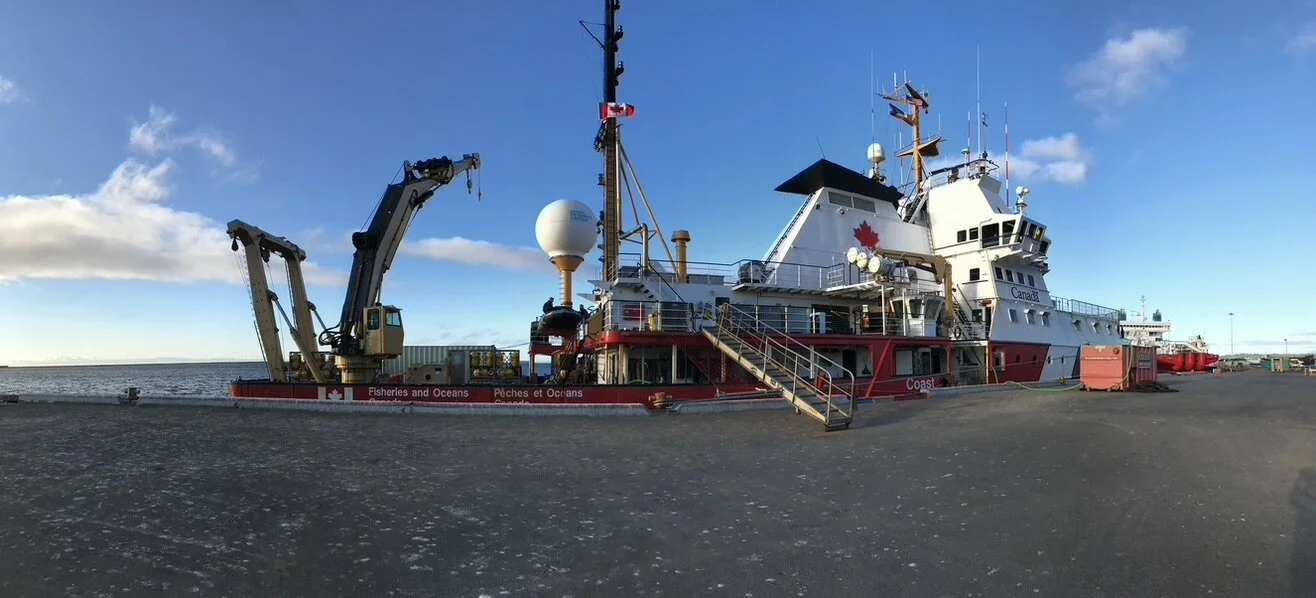
Here aboard the CCGS Tully, we are busily deploying ocean-bottom seismometer (OBS) instruments for the R/V Langseth to “shoot” to. The Langseth has been following the Tully around, setting off acoustic signals (sort of “miniature earthquakes”) using a towed, pressurized air system. Some of the crew aboard the Tully have referred to the Langseth as the “bubble blower” ship - adorable, and not entirely inaccurate! The high-energy bubbles send acoustic waves to - and through! - the seafloor, and those waves are then recorded by the OBS instruments the Tully has deployed.
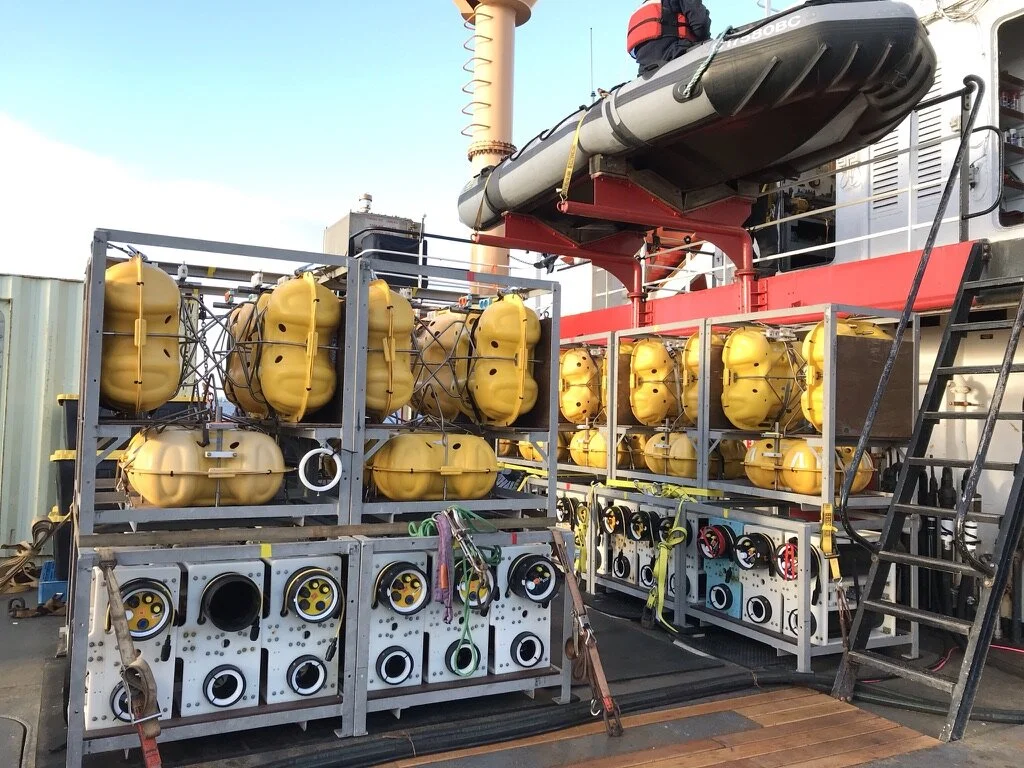
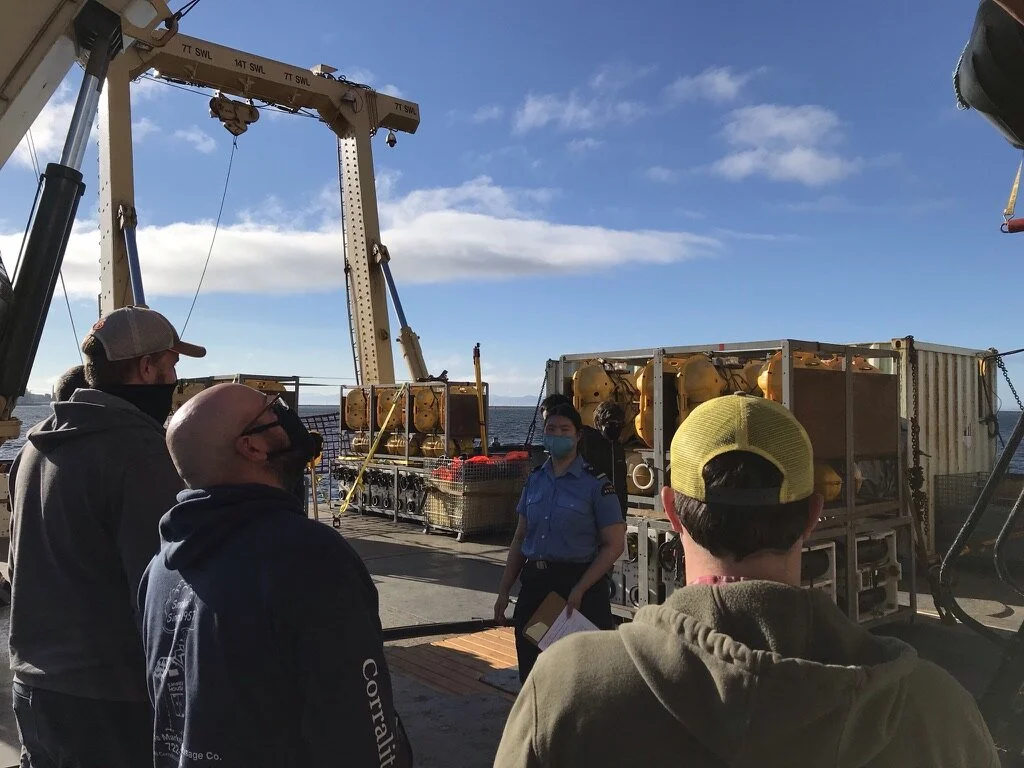
Tully science team and crew getting ready to deploy 2 different kinds of OBS instruments. Photo credit: Maureen Walton
The value of the OBS instruments is that they can record acoustic energy from the Langseth that has traveled deep into the earth’s crust and upper mantle - up to 10s of kilometers. This is one of the best methods available for peering into the physical properties of the crust, the outermost layer of the Earth. For this experiment, we want to image the crust on either side of the Queen Charlotte fault, one of the fastest-moving strike-slip faults in the world. In the past 100 years, the Queen Charlotte fault system has generated 7 earthquakes over magnitude 7; the most recent two events happened in 2012 offshore of Haida Gwaii, British Columbia (M7.8) and in 2013 offshore of Craig, Alaska (M7.5).
Large earthquakes often occur within the Earth’s crust, between tectonic plates. The Queen Charlotte fault separates the Pacific plate from the North American plate, and these plates slide past each other along the fault, causing earthquakes. If we can better understand what the Earth’s crust is made of on either side of the Queen Charlotte fault, we can (hopefully!) better understand why, when, where, and how earthquakes might happen along the fault.
Because the 900-km-long Queen Charlotte fault is located almost entirely offshore, it provides a convenient and ideal setting to deploy OBS instruments along both sides of a large portion of the fault. This makes it easy for a seismic research vessel (in this case, the Langseth) to generate acoustic energy that these instruments will record after the waves travel through the crust and upper mantle.
A map of the OBS station locations (small circles) along the Queen Charlotte fault, which is shown as a thin blue line running in between the longest transects of OBS instruments. Illustration credit: Emily Roland
Our experiment has been designed to image the crust and upper mantle along both sides of the Queen Charlotte fault to help us understand earthquake rupture processes and the relationships between the tectonic plates. We have 2 OBS transects running parallel to the fault on either side, and 3 OBS transects crossing the fault in key locations: 1) the 2013 Craig earthquake area (northern crossing), 2) the 2012 Haida Gwaii earthquake area (southern crossing), and 3) a spot where we can potentially see the extent of underthrusting of the Pacific plate beneath North America (central crossing). While we wouldn’t normally expect underthrusting along a strike-slip plate boundary like the Queen Charlotte fault, the southernmost part of the fault along Haida Gwaii is somewhat convergent. A key science question we have is whether (and how much) the Pacific plate has underthrust beneath North America in response to this convergence.
Ultimately, we hope that the results from this experiment will help scientists to better understand earthquake processes along not only the Queen Charlotte fault, but similar plate boundaries elsewhere - the San Andreas fault in California, for example, is a similar type of strike-slip plate boundary. We have already collected a lot of data, and are looking forward to digging into the analysis after the cruises!
Maureen Walton, research geophysicist and co-chief scientist aboard the CCGS Tully
Data Acquisition - Phase I
Leaving port in Seattle, the Langseth spent two days in transit to the survey site. As much as we’d like to sit back and enjoy our trek into the horizon by watching “The Office” and the occasional whale, we had some preparation to do. We used our time wisely and practiced processing seismic data and adjusting to our staggered 12 hour work schedules. Since there are only six of us, we need all hands on deck to make sure everything runs smoothly in the lab.
Lamont-Doherty Scientists and Technicians waiting for data
Huston we have a…Whale?
The Langseth has a boastly array of 36 airguns that use pressurized air to create a massive air-bubble that travels to the sea floor. In our case, we are shooting to OBS’s deployed by the CCGS Tully. These will record rays that reflect and refract through sediment layers which we can process later to interpret oceanic structure.
Given the right tools—creating an underwater sea-bubble seems easy enough, right? Think again. I was surprised by the variation of internal and external factors that cause complications in data collection. Our first hiccup occurred four hours into shooting, as a hose malfunction in the compressor room caused us to shut down a string of guns for about an hour.
To address the elephant in the room (or whale in the bathtub?) whales are our biggest threat to data collection in the daytime. When a whale is sighted, by law we are required to stop shooting to ensure protection of endangered species. In hopes to mitigate data loss, Lindsay and Ben consulted the scientists on the CCGS Tully and concluded to do a giant U-turn and resample the missing section. Often when the lab phone rings, we all hold our breath hoping it wasn’t a whale sighting.
Humpback whale courtesy of PSO Lillia
Amidst these minor setbacks, our science team has been working with everyone to get the data we need. At the time of writing this post we, have successfully deployed our 15km streamer and will be entering Phase II. More to come soon!
— Lazaro Garza
The original line we intended to shoot, that was broken into different sections due to whale sightings. You can see the Langseth’s path and the giant U-turns we made in our route.
Deployment!
Today is day 5 on the CCGS Tully, and we’re off to a great start! We’ve deployed 53 instruments, and as of the time of writing, recovered 4. Along the way we’ve seen whales, dolphins, and of course the beautiful Haida Gwaii.


Our experiment involves coordinating the deployment of these Ocean Bottom Seismometers (OBS) with the Langseth — the Tully deploys the OBSs, and the Langseth provides the signal that we analyze later. The Tully then retrieves the OBSs, and in a few months we’ll have beautiful data of a little-known fault system!
Between the Pacific living up to its name and the superhuman efficiency of the Tully’s crew, the deployment and recovery of the OBSs has been very smooth so far. Currently we’ve got almost all of our 58 available instruments out on the seafloor. To deploy the next few lines, we’ll need to pick up all of our instruments and rehabilitate them while underway — an intimidating goal, but our science party includes expert technicians from Scripps Institute of Oceanography and Woods Hole who are more than capable of making it work while training up a clueless grad student or two along the way.


Depending on how closely spaced our stations are, we have anywhere from 22 minutes to an hour to prepare an OBS for deployment. By now we’ve gotten into a rhythm, each of us working on part of the instrument to get it ready for seafloor deployment. So far we’ve been able to maintain our pace without stopping the ship, like a well-oiled (albeit well-rained-on) machine.
A successful recovery of an OBS!
Kevin Pszczola - WWU Seismology Graduate Student
Greetings from the CCGS Tully
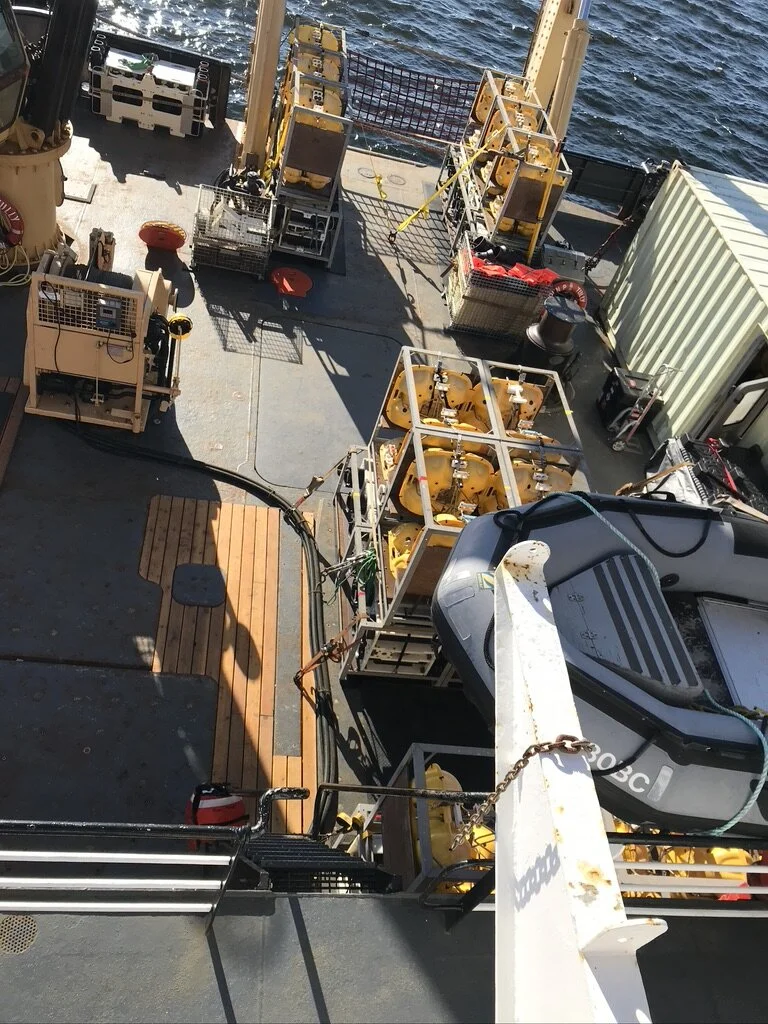
The fantail of the Tully, loaded up with OBS before departing the dock in Port Angeles, Washington.
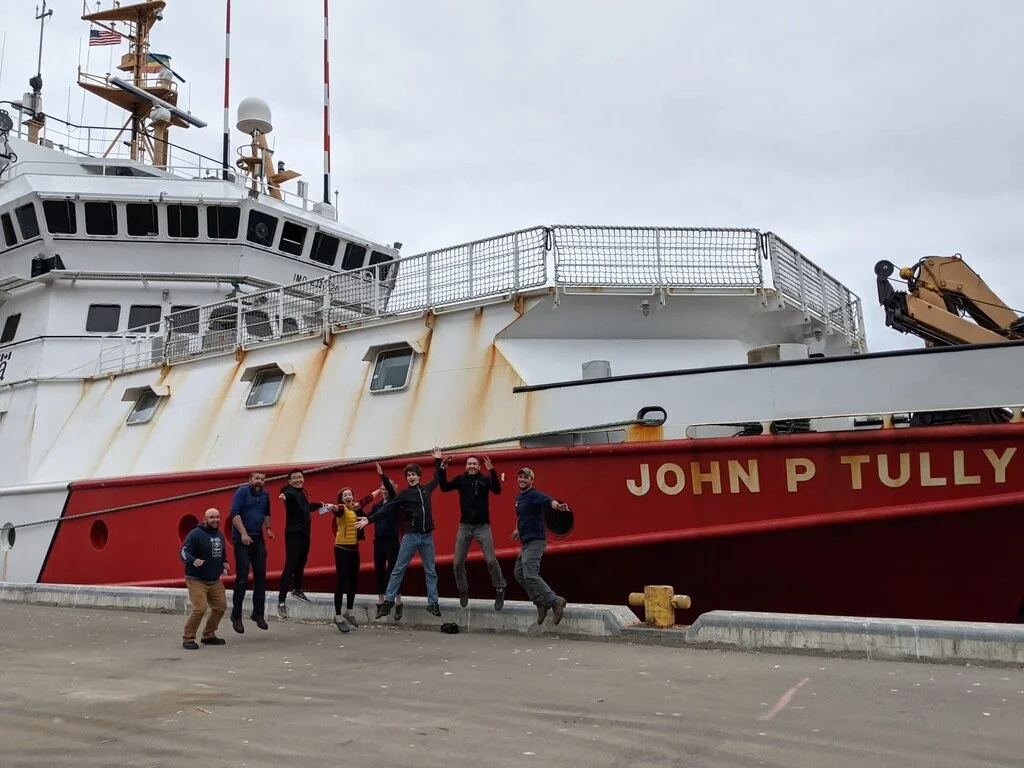
Writing you from the CCGS John P. Tully, en rout to the seafloor just offshore Haida Gwaii! Saying that we are excited to be embarking upon this experiment is an understatement.
The Tully’s primary job for the next month will be to deploy and recover Ocean Bottom Seismometers, that can record the sound source on our sister ship, the Langseth. The data collected by these OBS will be used to create detailed images of the Queen Charlotte Fault and surrounding crust.
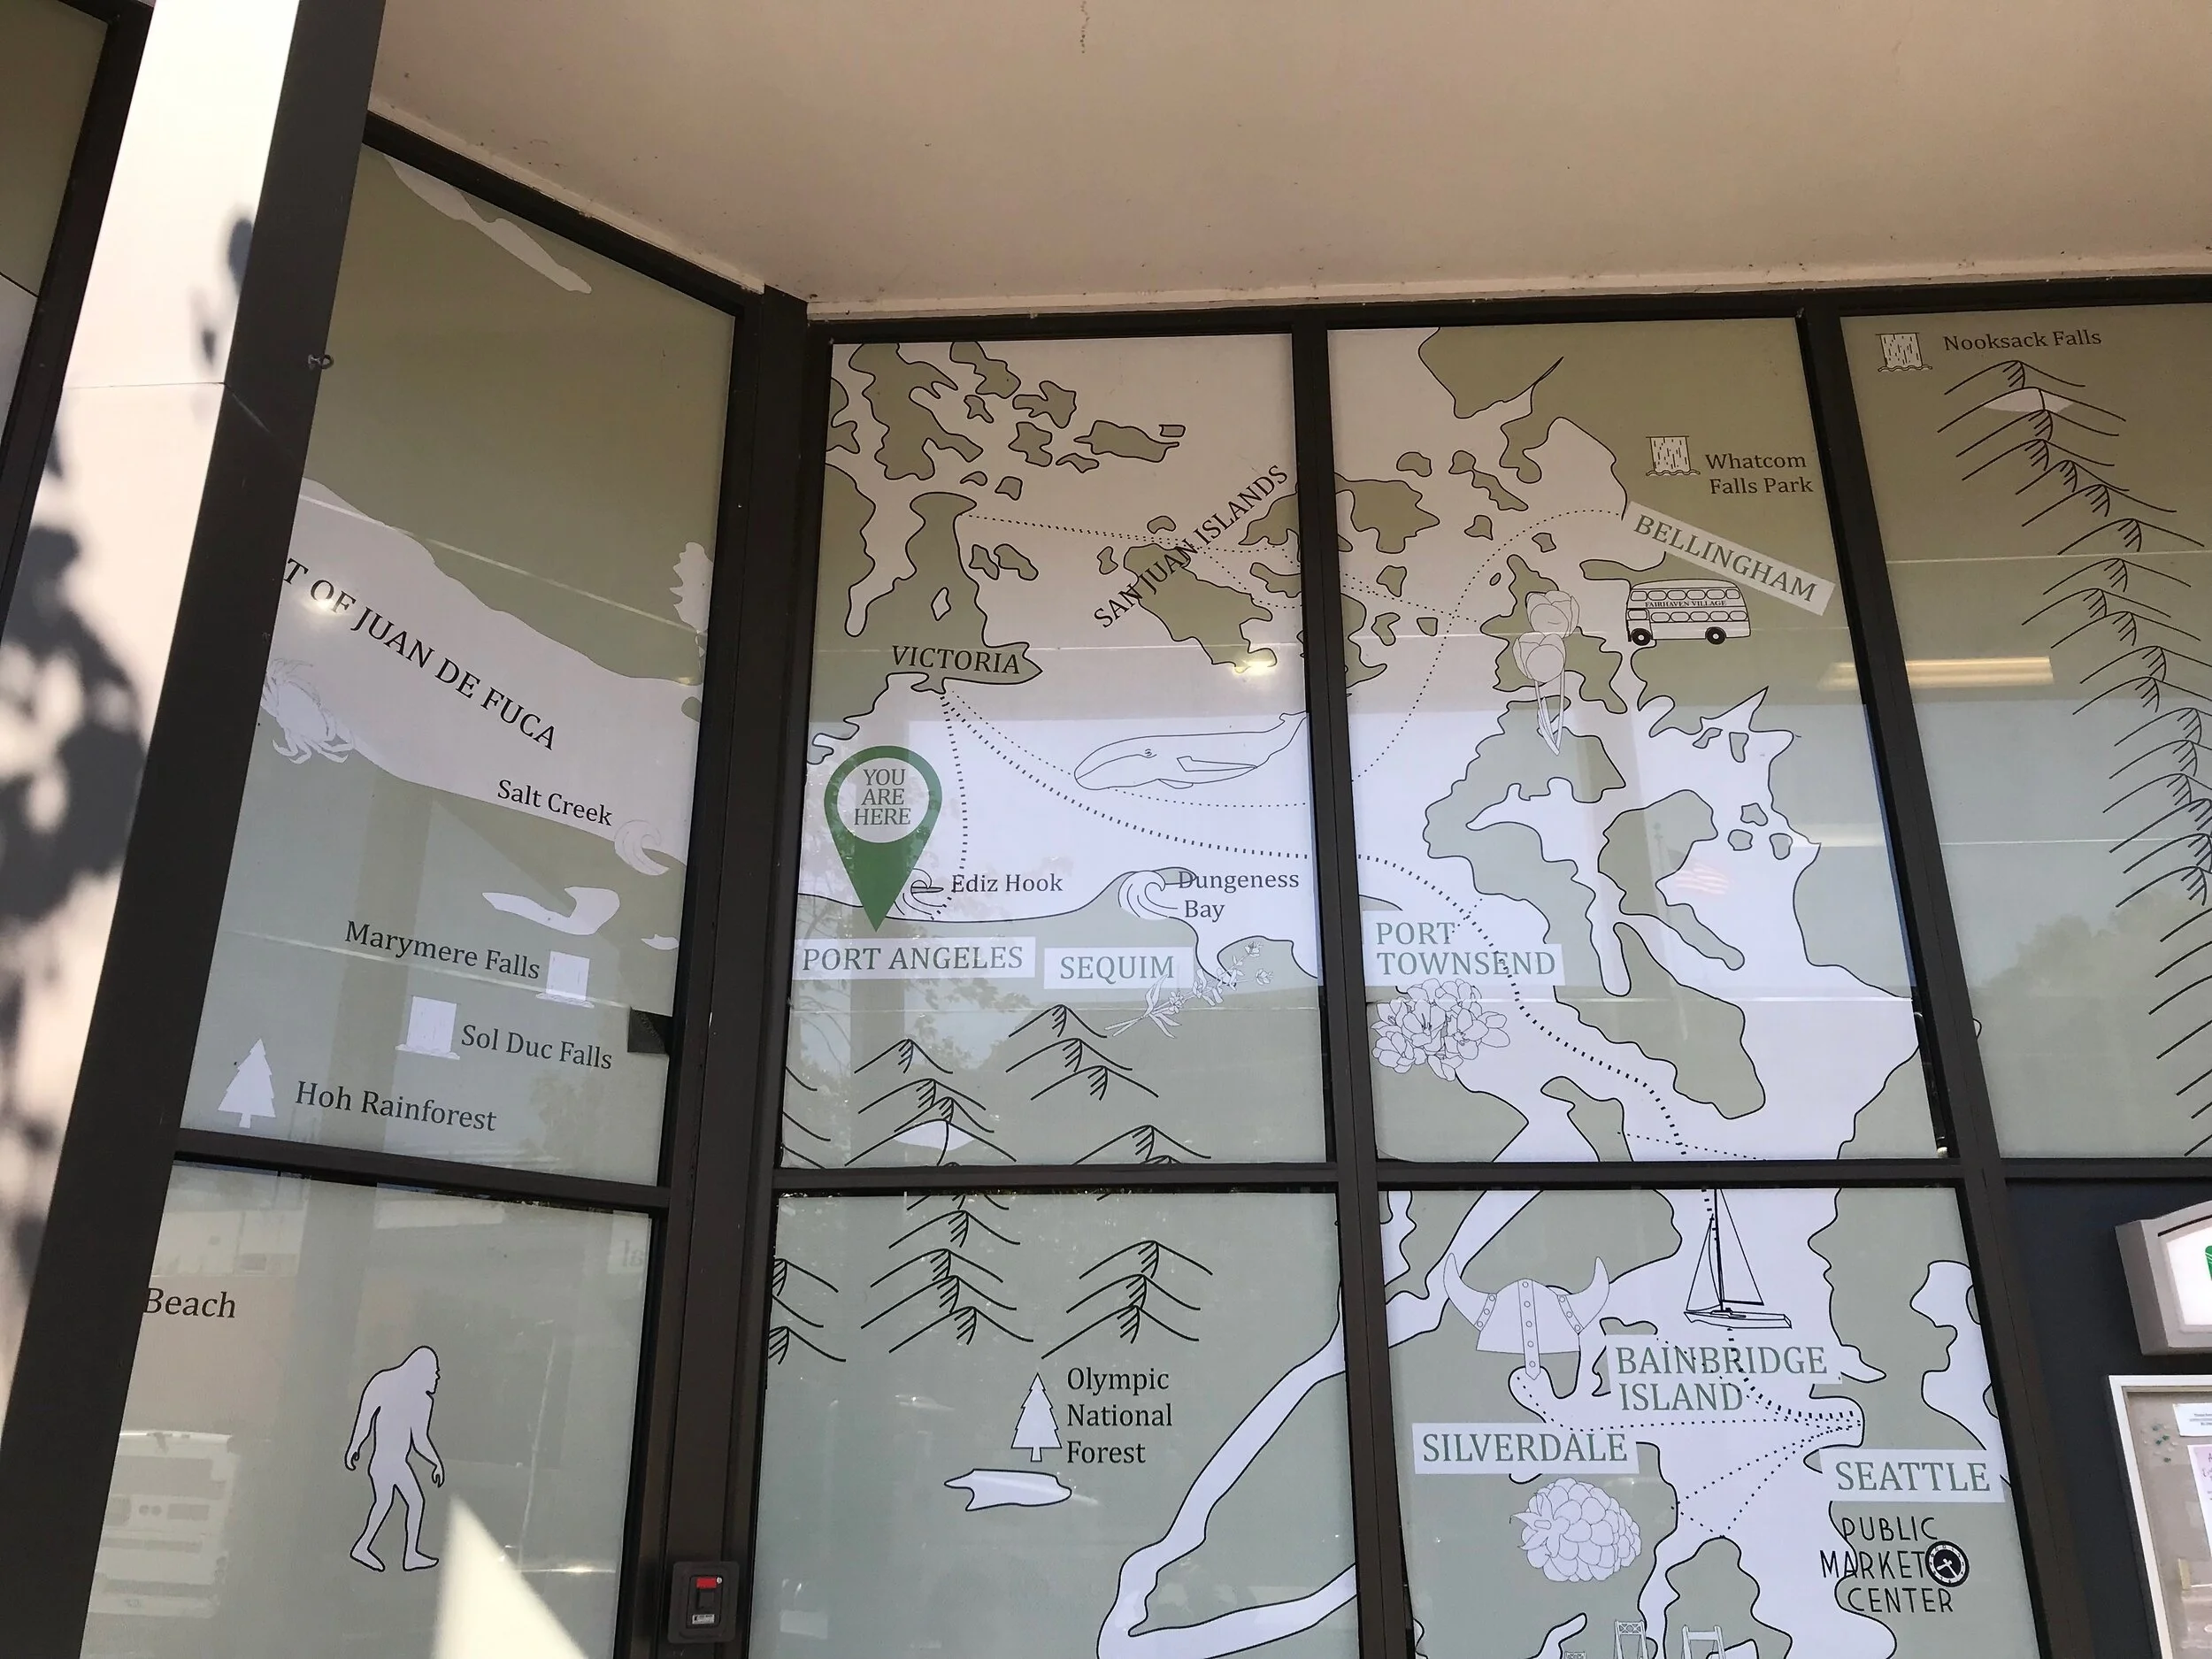
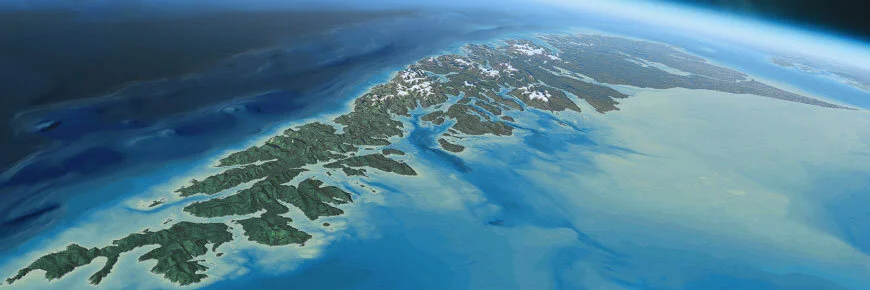
A cartoon map of the Salish Sea and Juan de Fuca straight as found outside a bank in Port Angles. Click on the image to get a perspective view of Haida Gwaii, offshore British Columbia. Where we’re started and where we’re headed.
After much planning, permits, and logistical efforts, it is thrilling to have left the dock in Port Angeles en rout to our study are. It’s been a bumpy year of cancelled cruises, quarantines, testing protocols, and unusual travel, but from the moment we arrived at the dock, things have been falling into place.
In a little over a day, we’ll be arriving at our first OBS deployment station. The Science party, OBS Technical team, Captain and Crew of the Tully are all poised and ready. For now however, all we have to do is double check, and triple check that the instruments are configured, enjoy the world-class hospitality of the Tully crew, and get some rest. Once we arrive at our first station - we’ll be working around the clock to deploy the first 16 OBS that make up our first, north-south transect (experiment map).
Since arriving on the ship, I’ve been so impressed and grateful for the Crew and Science Party’s “Can Do” attitude - and I have a feeling that this experiment is going to be a huge success because of them.
We were welcomed to the open ocean, after leaving the Straight of Juan de Fuca this afternoon by a group of humpback wales (not given justice in the above fuzzy photos), spouting and slapping their fins off the Port Bow. Seemed to be a sign of what good things are to come. Looking forward to getting started.
More updates coming soon!
Emily Roland - Chief Scientist aboard the John P. Tully
Move in day!
First impressions
Amidst the hustle and bustle of the continental breakfast at the Staybridge hotel, we all gathered in the lobby at 8:30 am. After strictly meeting digitally via zoom and going on our daily walk with our designated buddy, it was motivating to see all the scientists together, almost as if we were the next “Avengers”. Todd, one of the science officers, made short time of our drive to the port as we all gave introductions. Upon arriving we were welcomed by the mighty starboard side of the Langseth. At first glance it looked like something out of the TV show The Deadliest Catch with its own set of unique tools – cranes, cables, air guns, ocean bottom seismometers (OBS’s for short), and more. After our group picture and we began to carry our gear up the gangway, I could tell the vessel was much more than a glorified fishing boat. Mechanics, engineers, technicians all wove in and out of the Langseth’s doors and scaffolding, kind of like the whizzing gears of a fancy wristwatch.
Science Party!
Lab and safety tour
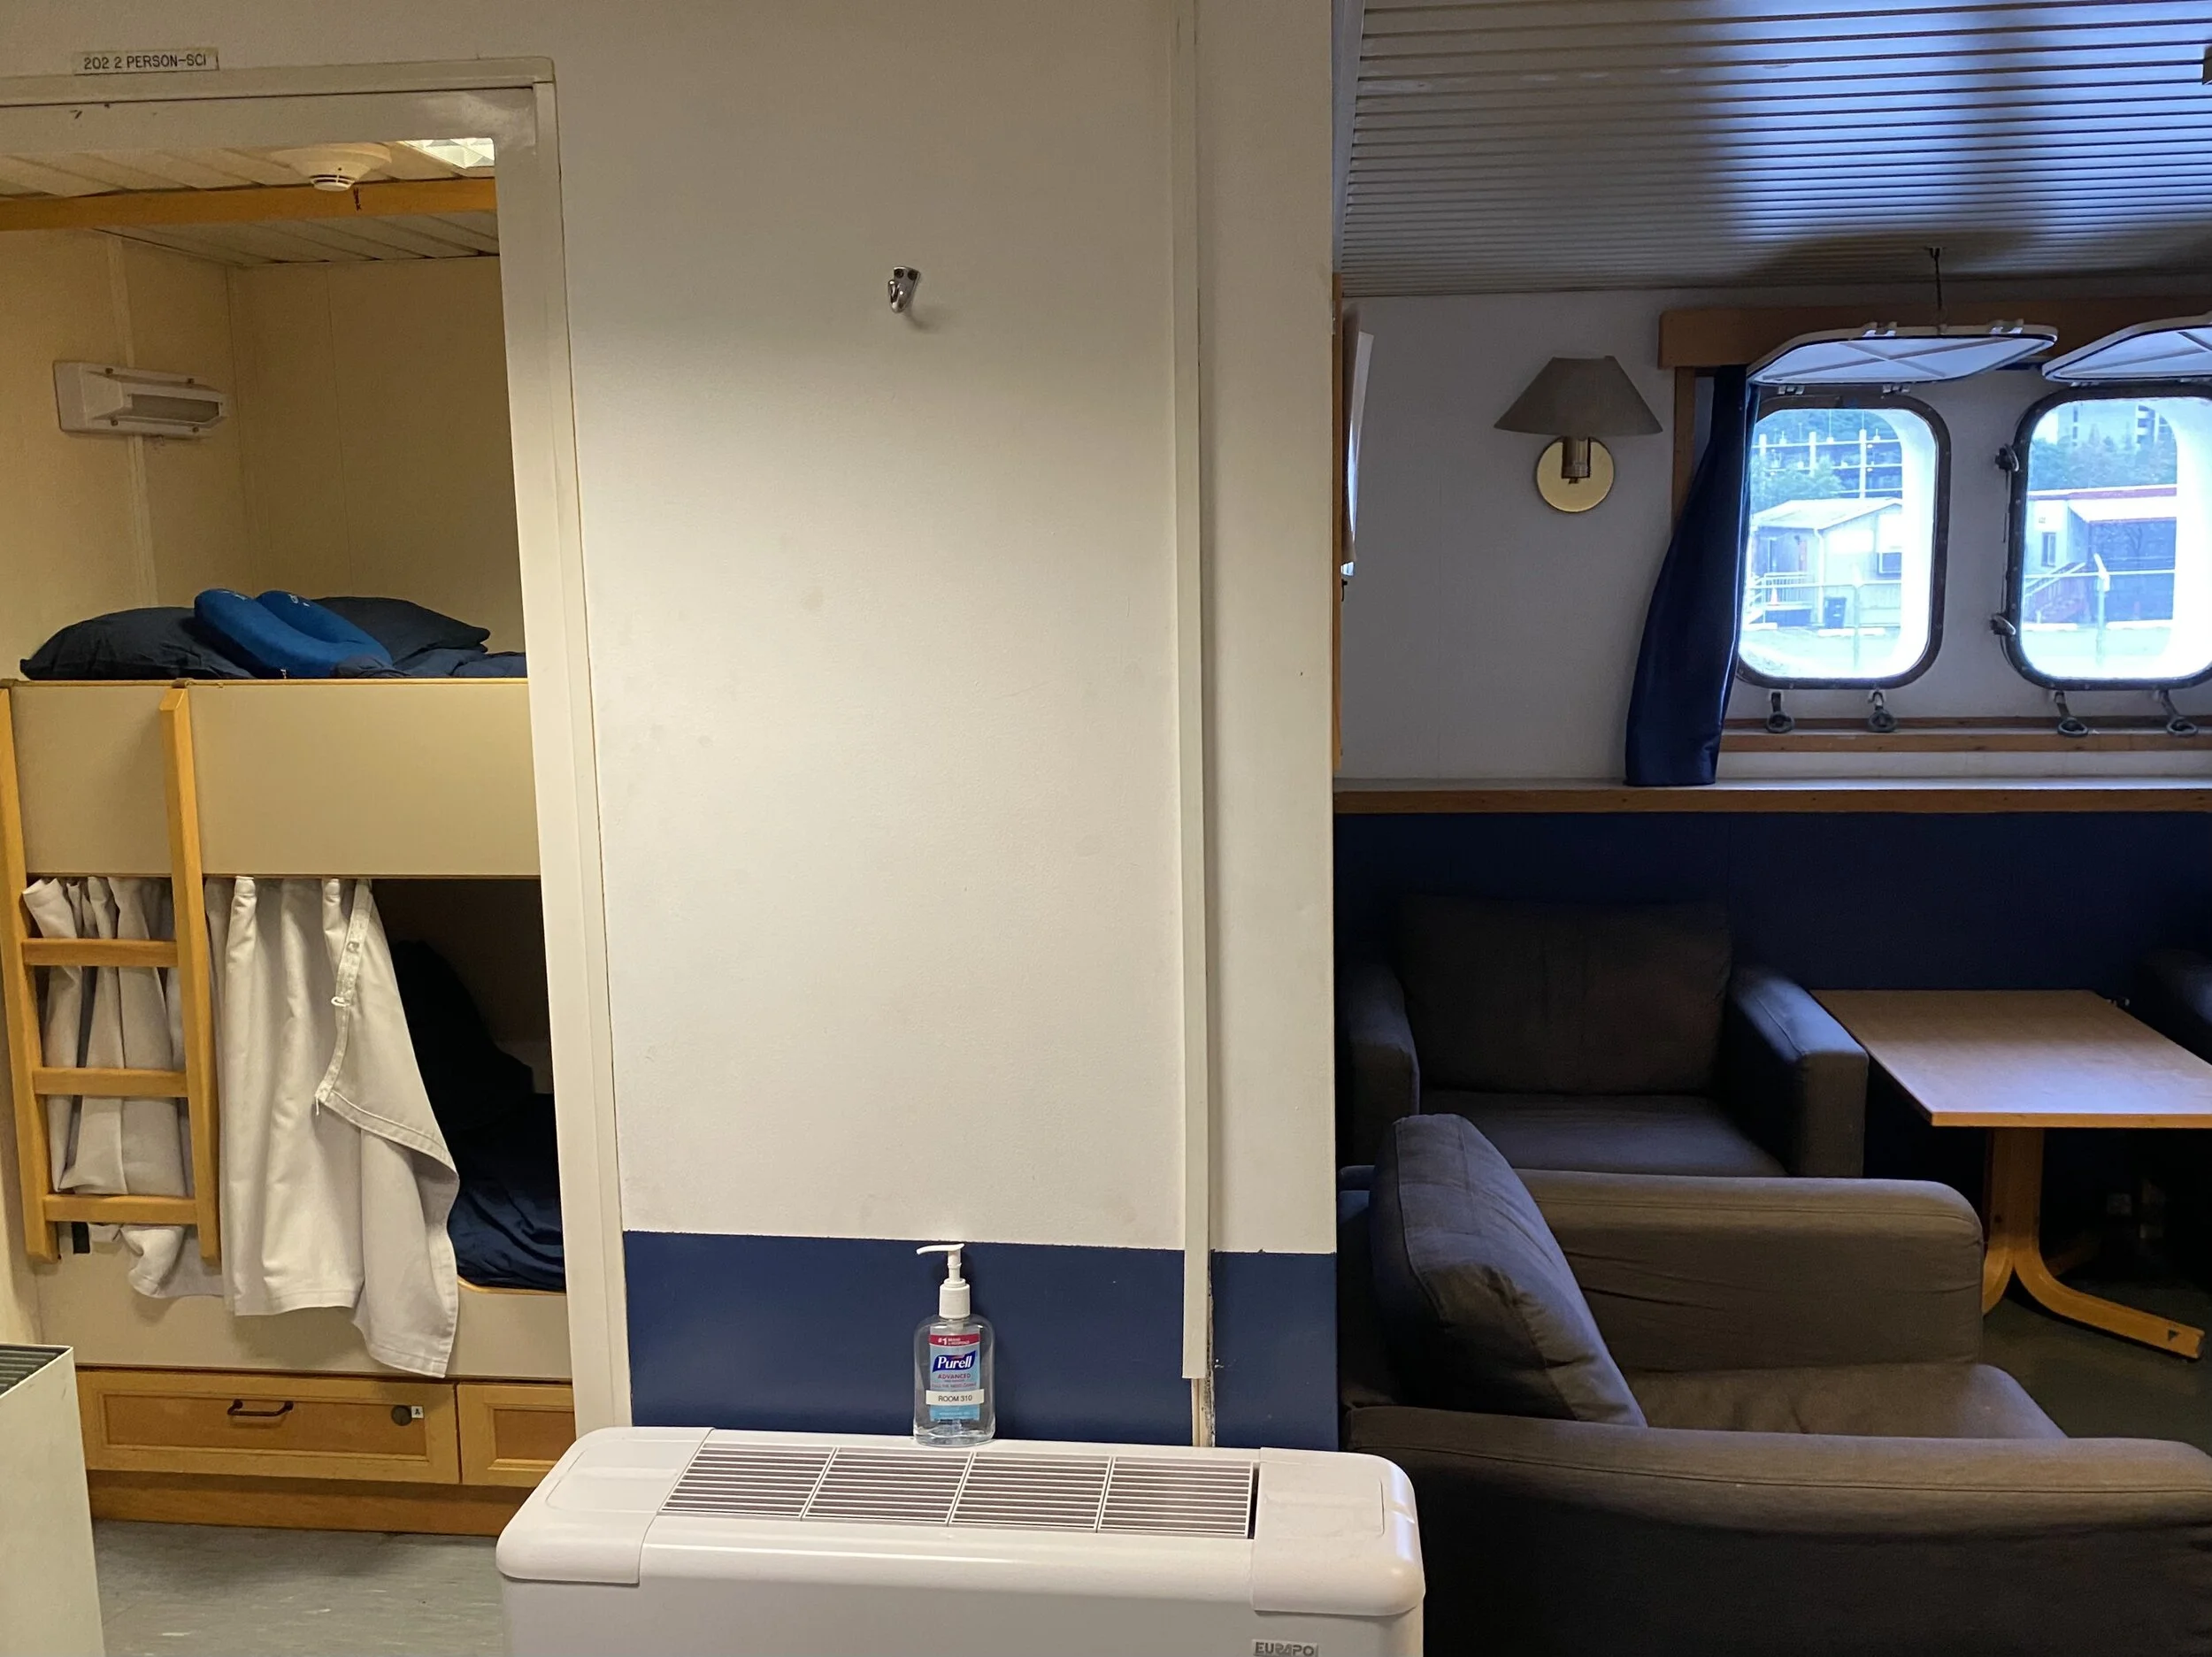
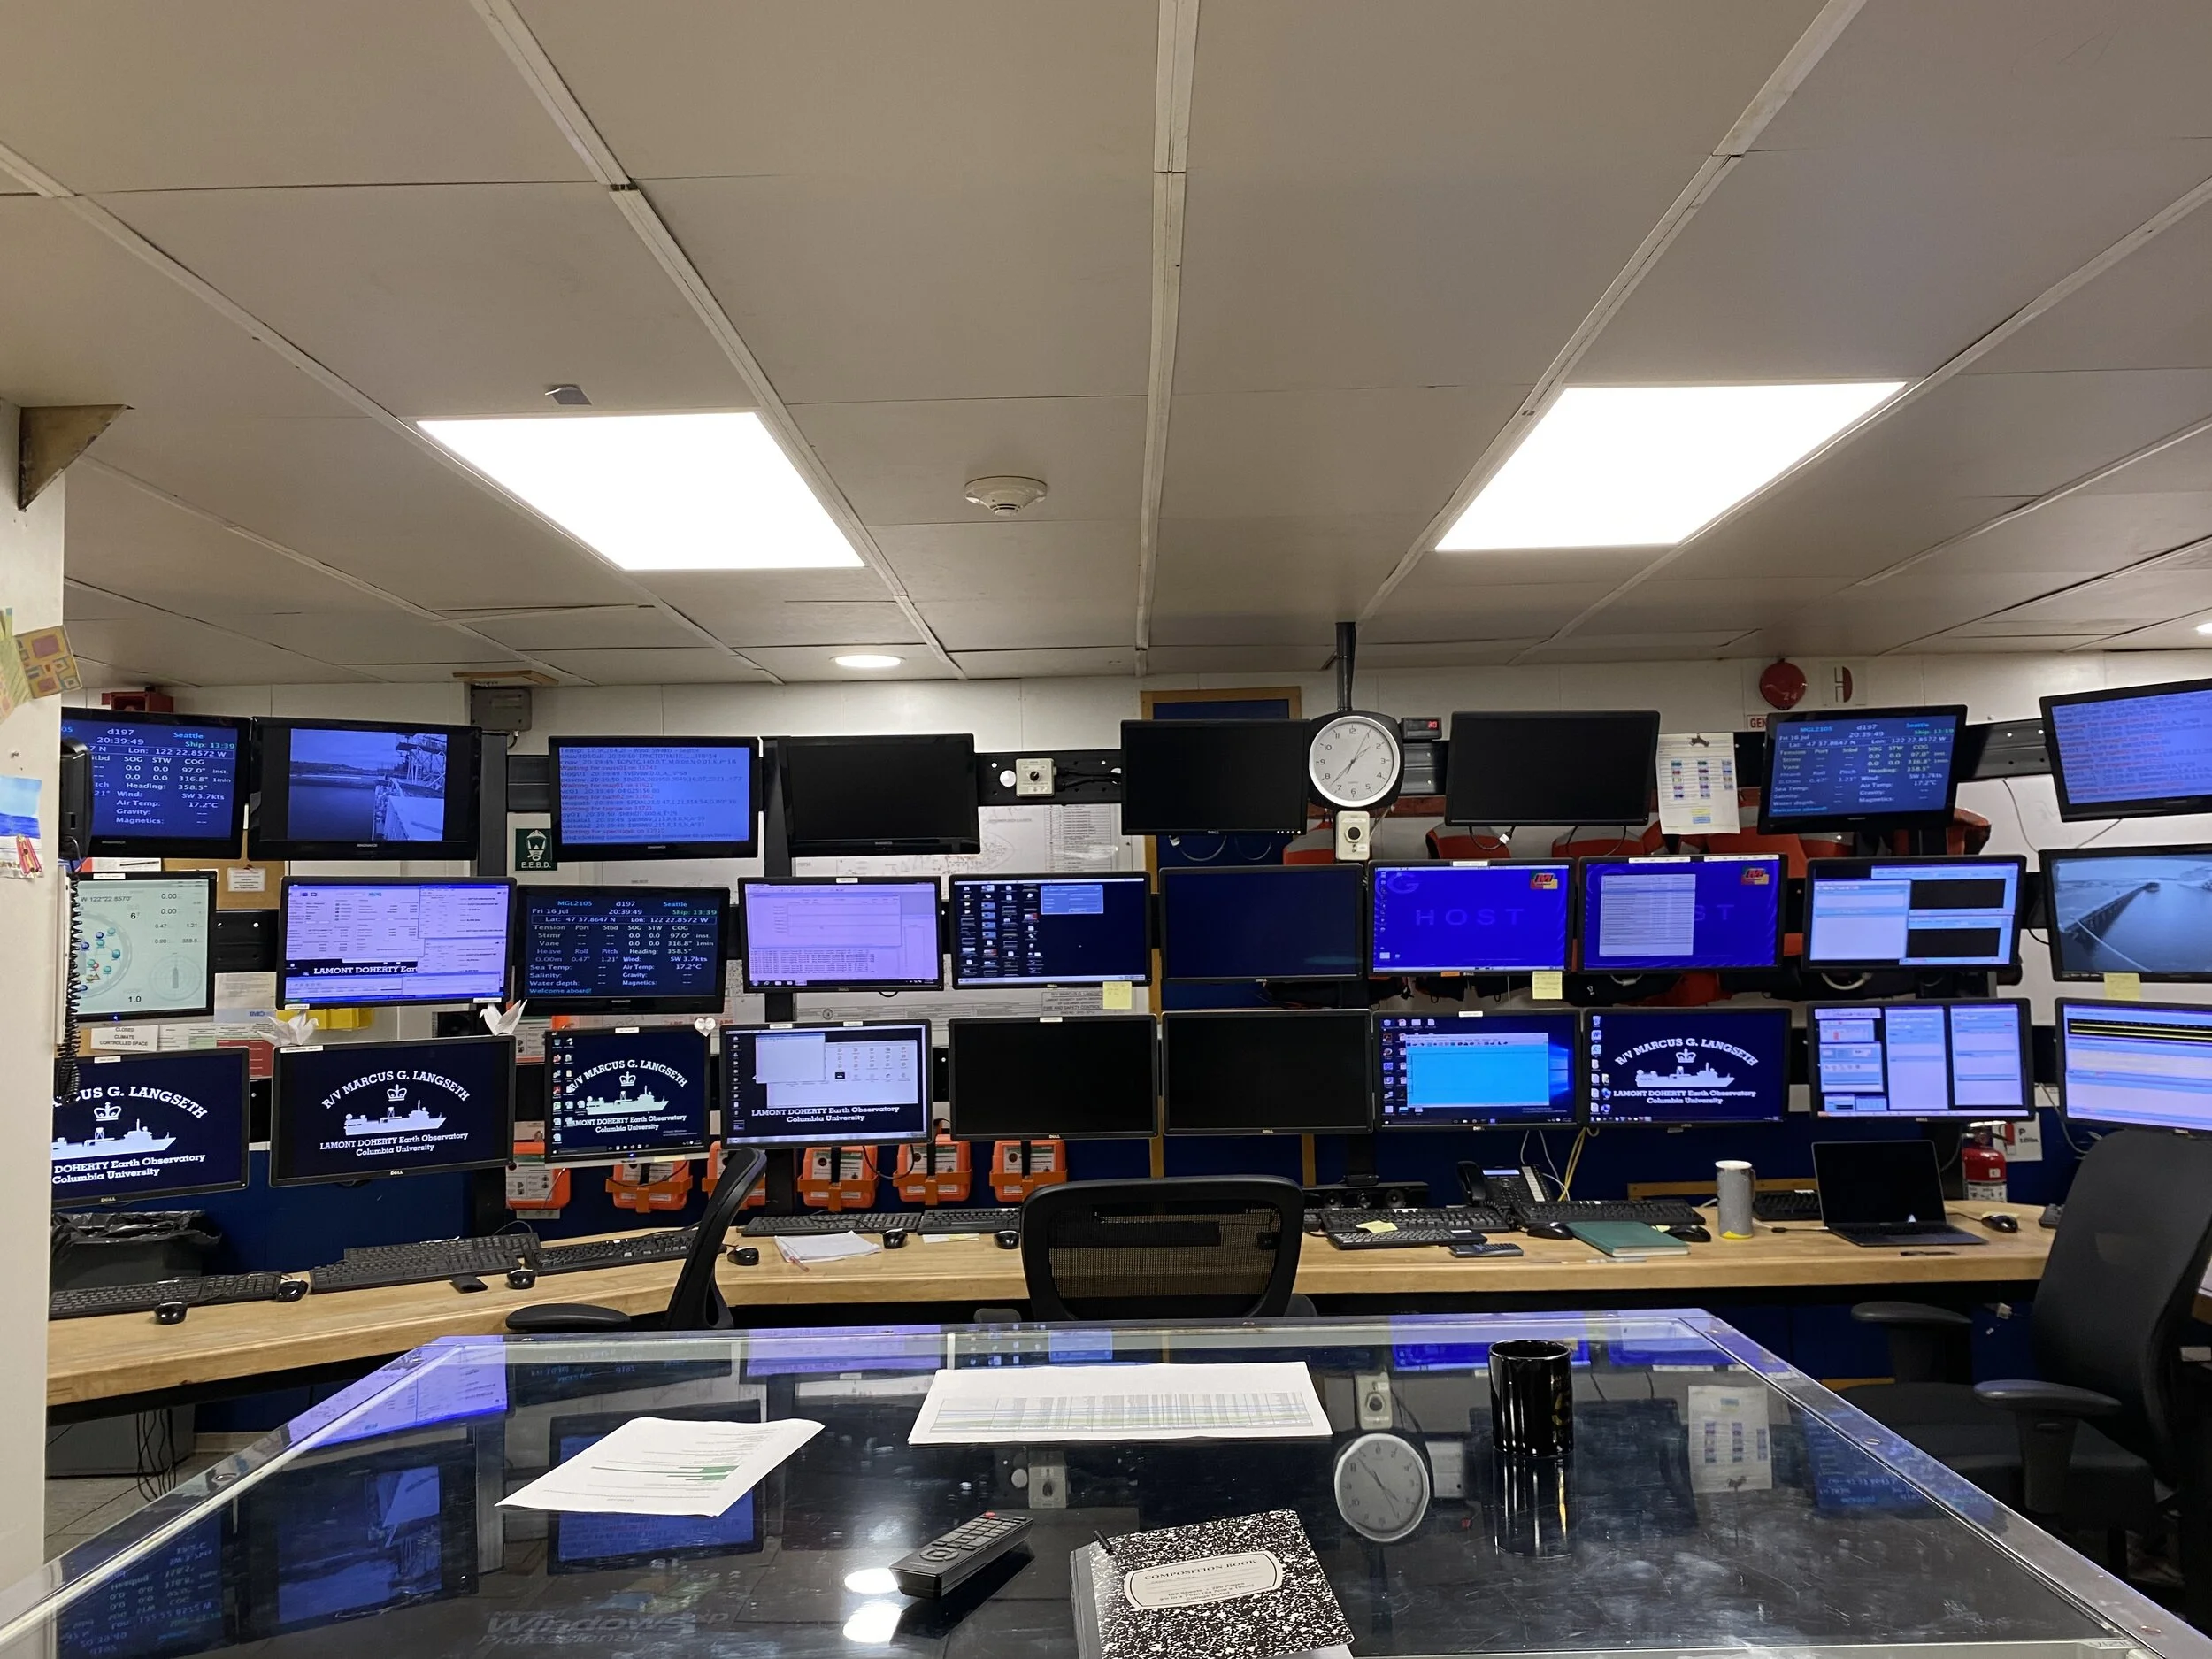
Entering the “Snake Pit” we were met with a common area that branched out into four modest rooms. This wasn’t any sort of Carnival cruise you hear on TV– we all knew that—so the accommodations were accommodating. Plus, we were right next to laundry and the galley, maybe that will give us an advantage to good food and clean clothes (midnight snacks maybe?). After settling into the “Snake Pit” we all congregated in the lab and spoke with some of the protected species observers (PSO’s for short…there’s also a lot of interesting lingo out at sea, I’m keeping record and trying to decipher them all) with whom we share some of the lab space with. The lab is no joke, a semicircle of monitors lined the adjacent entrance wall and even more individual monitors along the sides and back walls. I can only imagine what the lab will look like once we start collecting data! After our short group up we had burritos for lunch, not a bad welcoming meal from the galley. We then got a safety and life at sea run down followed by a tour of the main parts of the vessel. We also learned what was ok and NOT ok to touch. There are several places on the boat that mean serious business, but if we asked the right people, they would be more than welcome to give us a tour what they do.
The “Snake Pit”
Life at sea is far from glamourous, but ammenties come at the cost of collecting cutting edge data on a vessel with a rich history on the open seas. The Langseth, for many, was their office and temporary home, and for the next 40 days it will be ours too.
- Lazaro Garza
Main lab, something straight out of James Bond…
The waiting is the hardest part?
Hello world! Well, after pandemic delays, hundreds of conference calls and untold hours of optimizing line locations and survey plans, we have reached the final countdown!! We can’t wait to get on the water and start collecting data!
Space Needle on view during our daily exercise period.
This is a two-ship operation—the R/V Langseth science party arrived in Seattle last Friday to begin a seven-day self isolation and we will get on the this Friday. The CCCG Tully science party is also isolating near Port Angeles and will board on Thursday. Both ships will hit the open seas en route to the survey area.
During self-isolation, we’ve been lucky to get some outside exercise time in downtown Seattle and a couple of us were even able to hike over to see the Langseth in all her glory at the dock.
Visiting the Langseth — our soon-to-be home for 40 days!
In the mean time, we are treating our self-isolation as a long transit—with Grubhub! We have science meeting happy hours every night to catch up and discuss papers and are prepping for setting sail.
More to come as we get closer to the survey and board the ship!
-Lindsay Worthington


