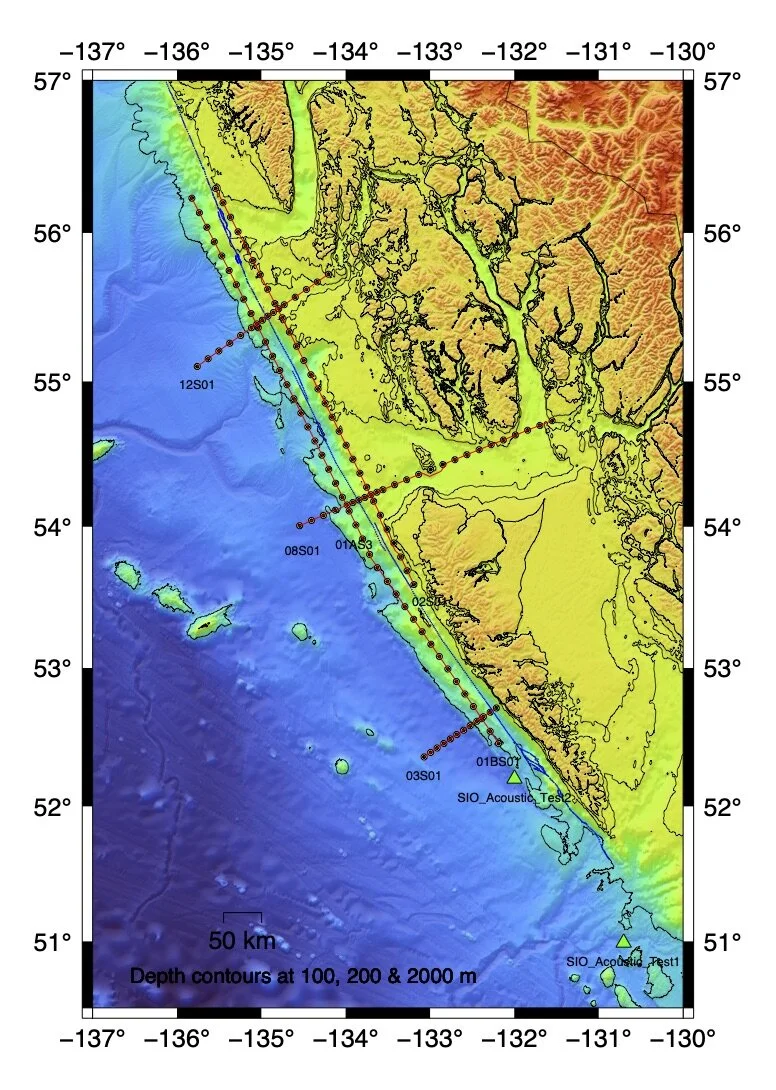
Experiment map - showing the ocean bottom seismographs as black dots, and lines that will be profiled by the Langseth as Red lines. Our current best estimate of where the Queen Charlotte transform fault extends to the surface is shown in blue.
Experiment map - showing the ocean bottom seismographs as black dots, and lines that will be profiled by the Langseth as Red lines. Our current best estimate of where the Queen Charlotte transform fault extends to the surface is shown in blue.